Introduction
This year, I’m launching my first-ever March Madness forecast for both the men’s and women’s tournaments. Every day, the forecast simulates thousands of potential tournament outcomes to see how far each team will advance and which team has the greatest chance of winning the national title.
Powering the forecast is the first iteration of the MADHATTRS1 system. MADHATTRS — which stands for Multivariate Attack / Defense / Home Adjustments To Team Ratings (via) Simulation2 — is a series of models that estimates each team’s offensive and defensive strength as well as their home-court advantage. Like other Elo-adjacent systems, MADHATTRS is applied at the team (rather than player) level.3 Unlike other systems, MADHATTRS is fully Bayesian under-the-hood and enjoys all the benefits of Bayesian inference — most importantly, propagating uncertainty throughout the system.
1 This is a not-so-subtle nod to my family’s long-standing March Madness bracket group name, MadHatters.
2 What would any forecast be without a wonky backronym?
3 Examples of player-level metrics include FiveThirtyEight’s RAPTOR or ESPN’s real plus-minus.
As always, this work is fully open source — code to prep data, fit the models, and render site graphics can found in the project’s repository on GitHub. The READMEs throughout the repository describe the system in detail but I provide a high-level overview of the core components of the forecast below.
The whole game
MADHATTRS is split into several different models but each has the same two fundamental objectives:
- To estimate each team’s rate of points-per-minute (PPM) in each game.
- To estimate the number of overtimes played in each game.
Each team’s PPM is a function of their offensive output, their opponent’s defensive skill, and whether or not they have a home-court advantage. When playing away from home — either as the away team or on neutral territory — the Home Advantage goes to 0 and doesn’t contribute to PPM. Adjustments to PPM are made relative to a fixed point, 1.75 PPM, which translates to an expected 70 points in 40 minutes of regulation.4
4 This fixed point is picked somewhat arbitrarily — the exact value doesn’t matter, just that adjustments are made relative to this value.
\[ \text{PPM} \sim \text{Offense} - \text{Opponent Defense} + \text{Home Advantage} \]
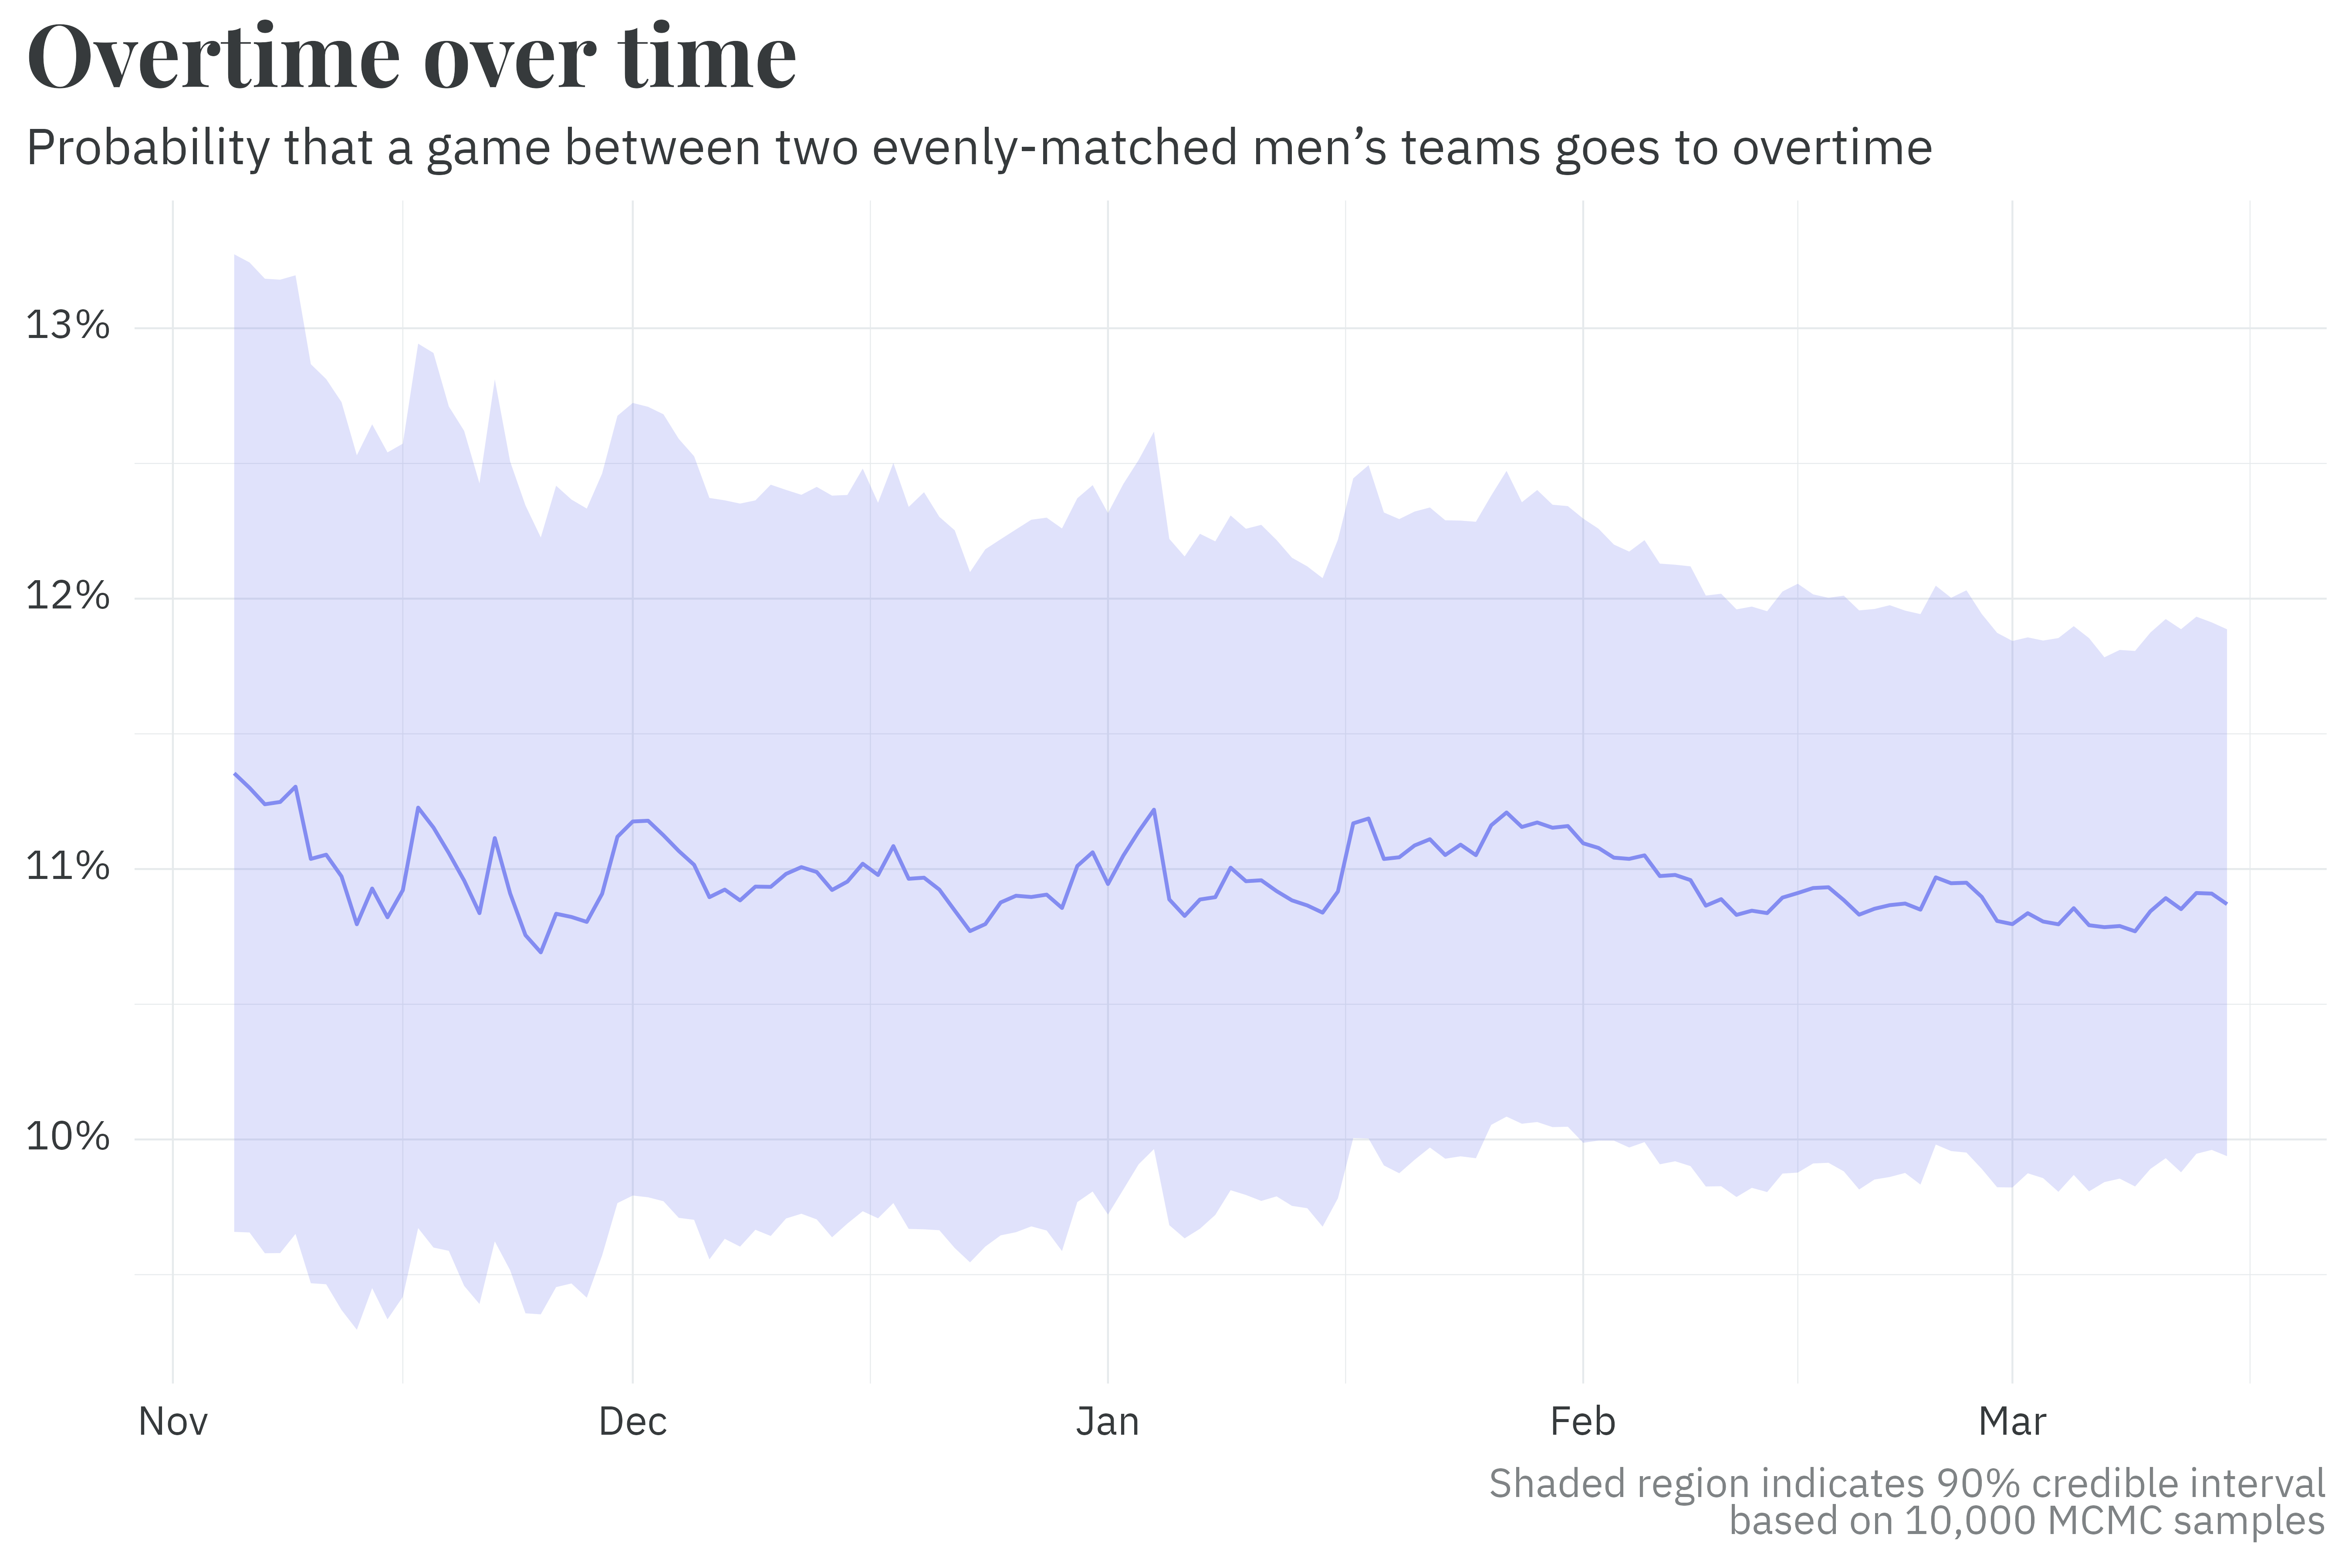
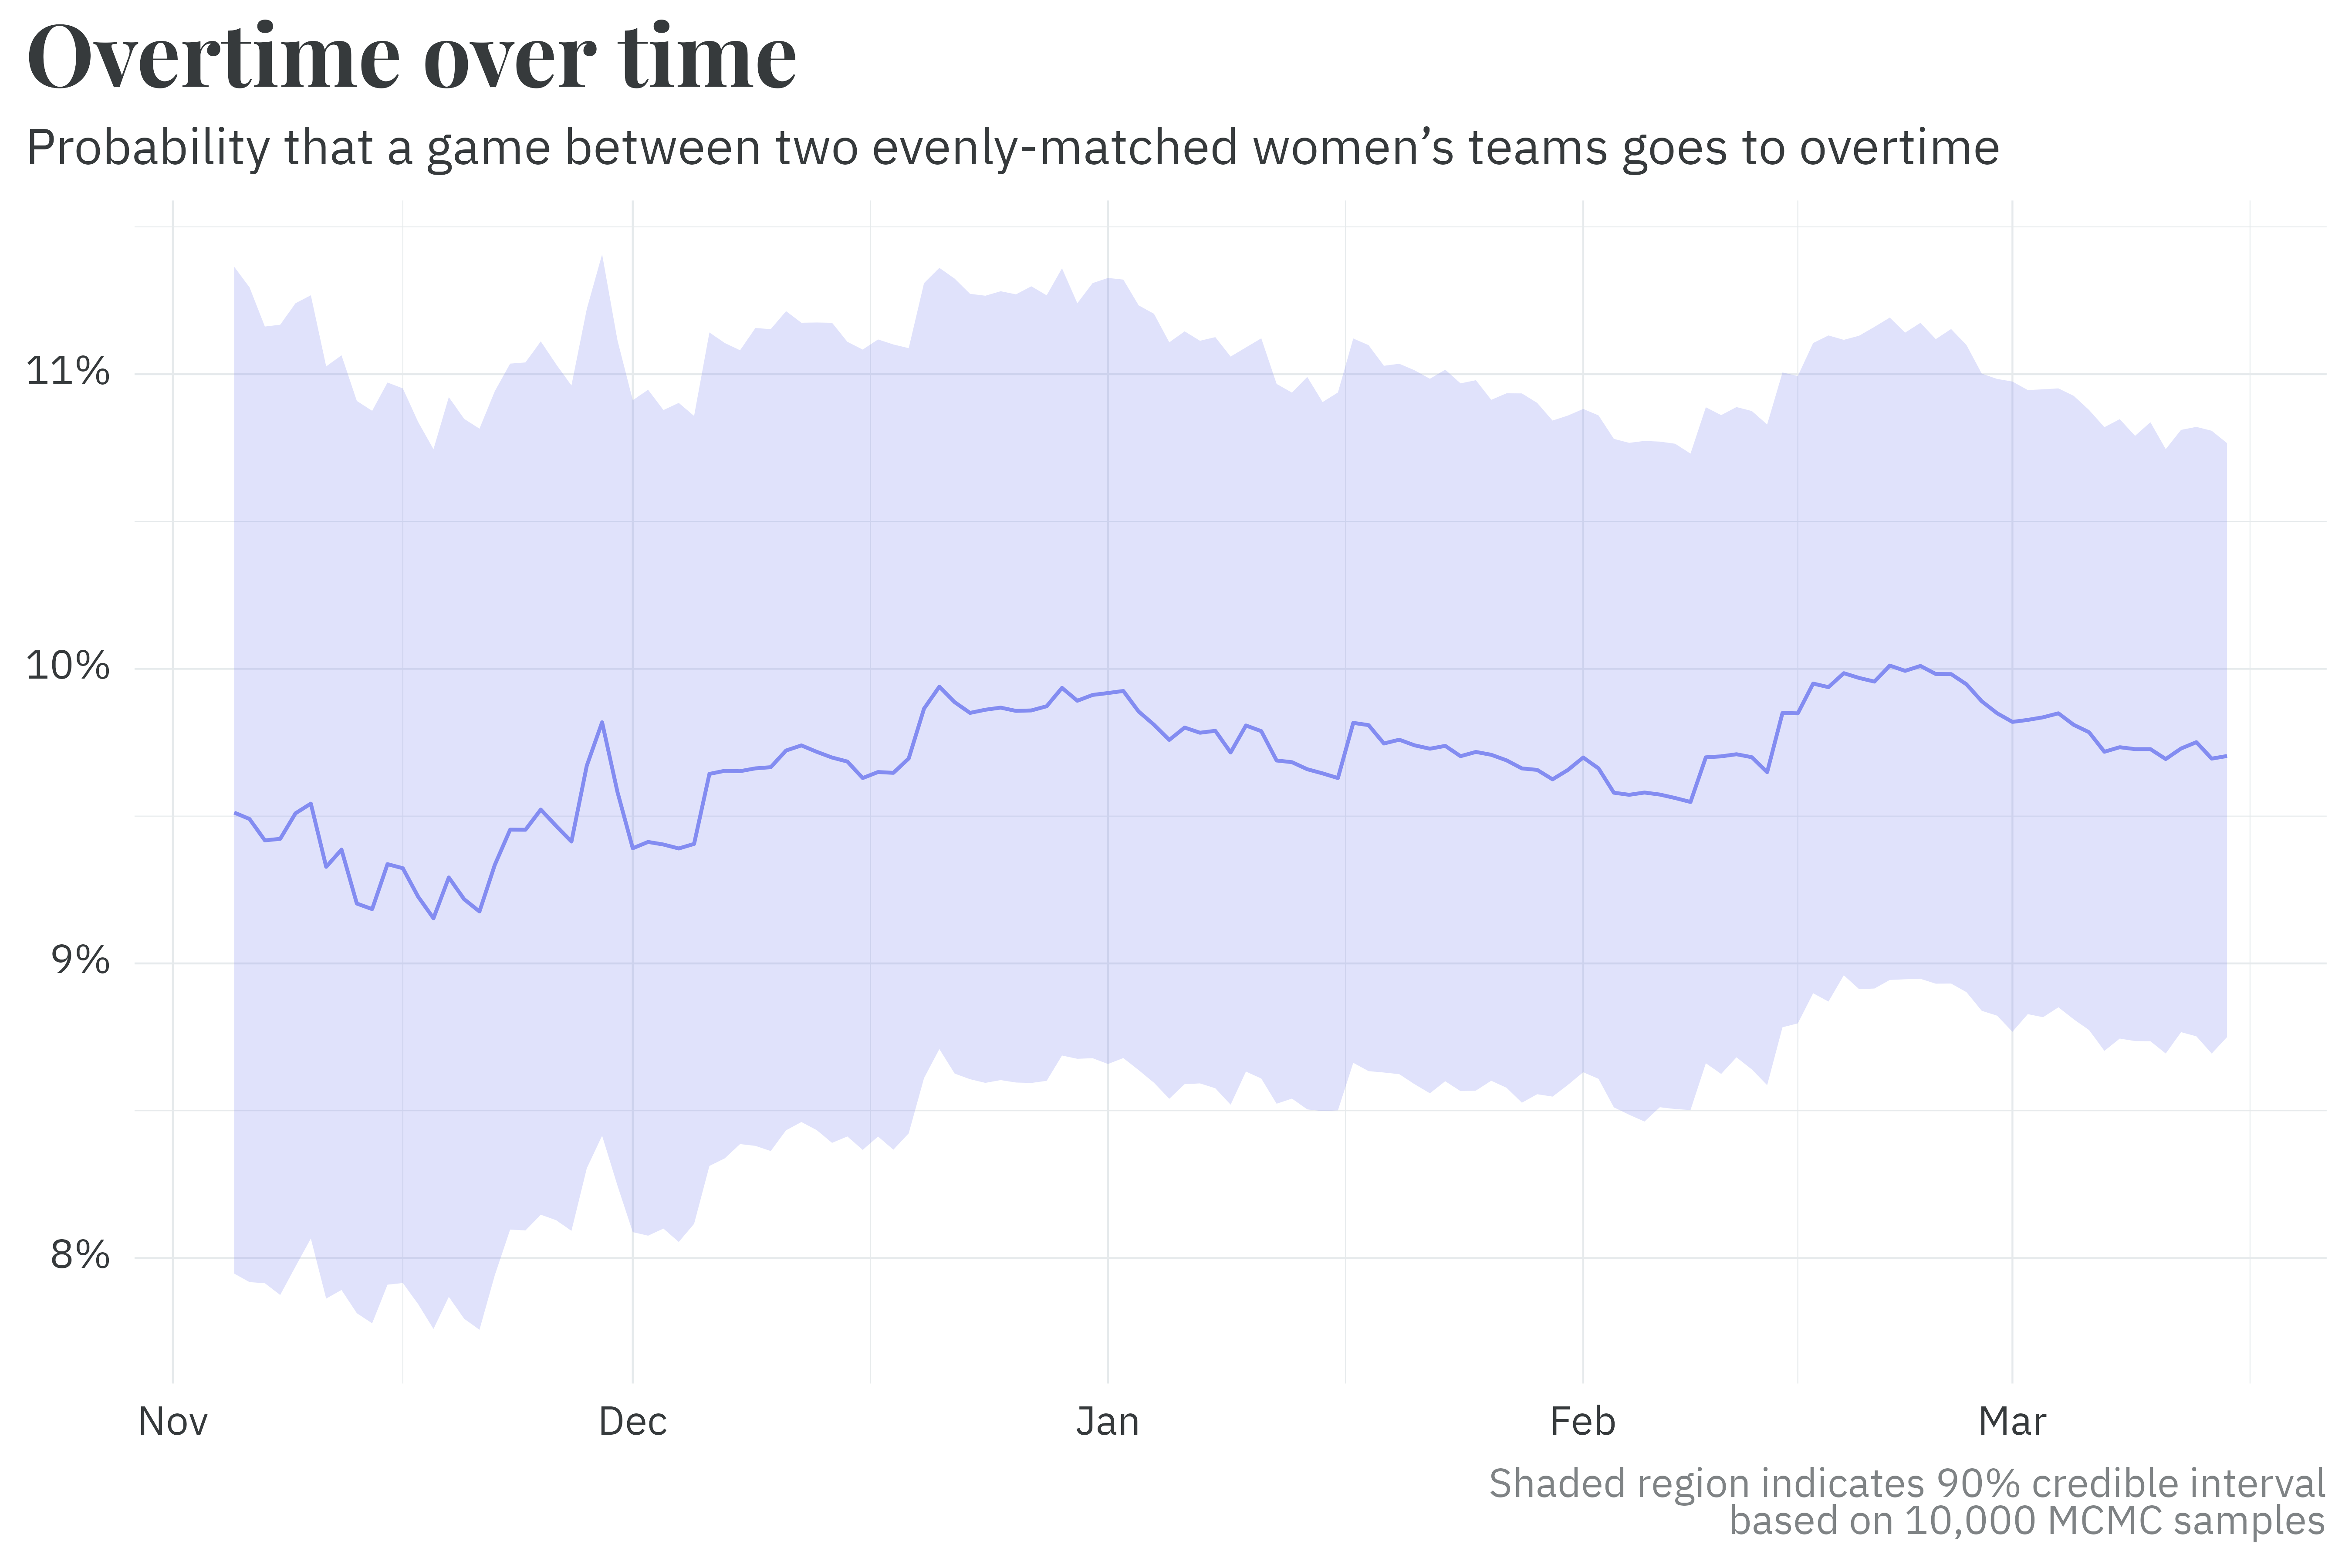
The number of overtimes played is modeled by scaling the absolute difference between each team’s PPM.5 Games between two teams with similar PPMs — be they high or low skill — are likelier to go to overtime than lopsided games between a low-skilled team and a powerhouse.
5 Technically, I estimate both the probability of the game going to overtime and the number of overtimes via a hurdle model.
\[ \text{Overtimes} \sim \text{Scaling Factor} \times \left| \text{PPM}_{\text{home}} - \text{PPM}_{\text{away}} \right| \]
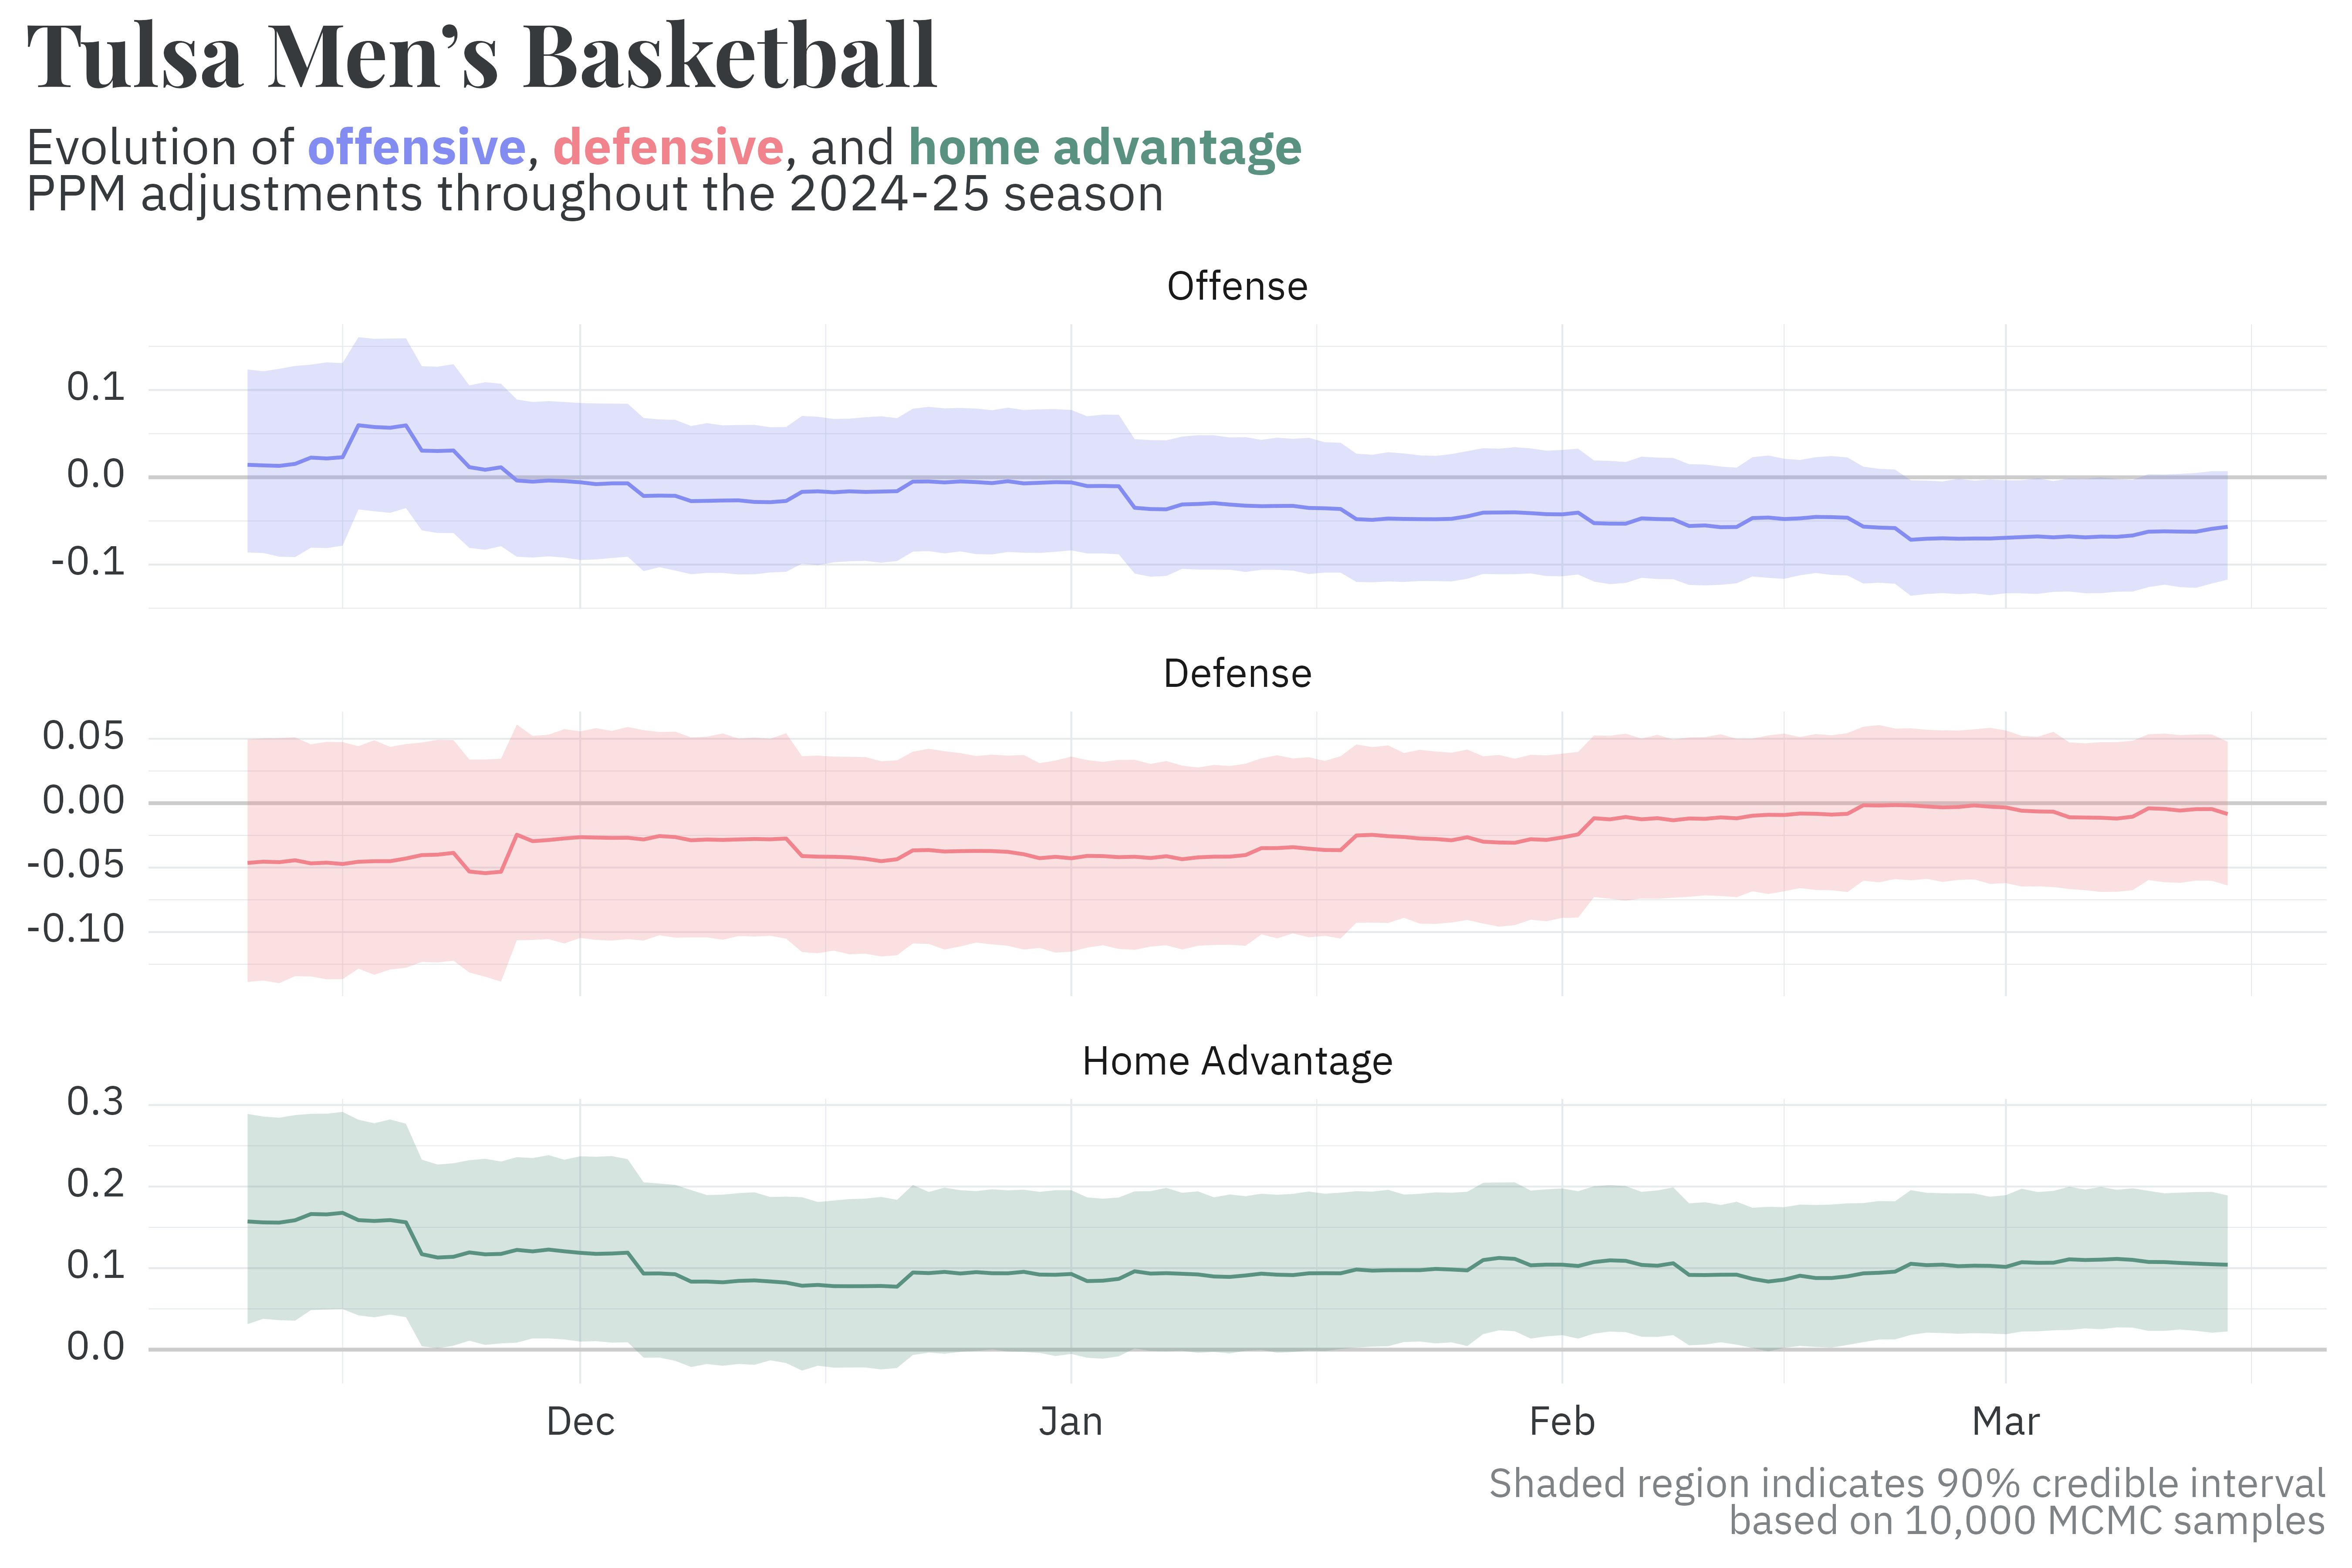
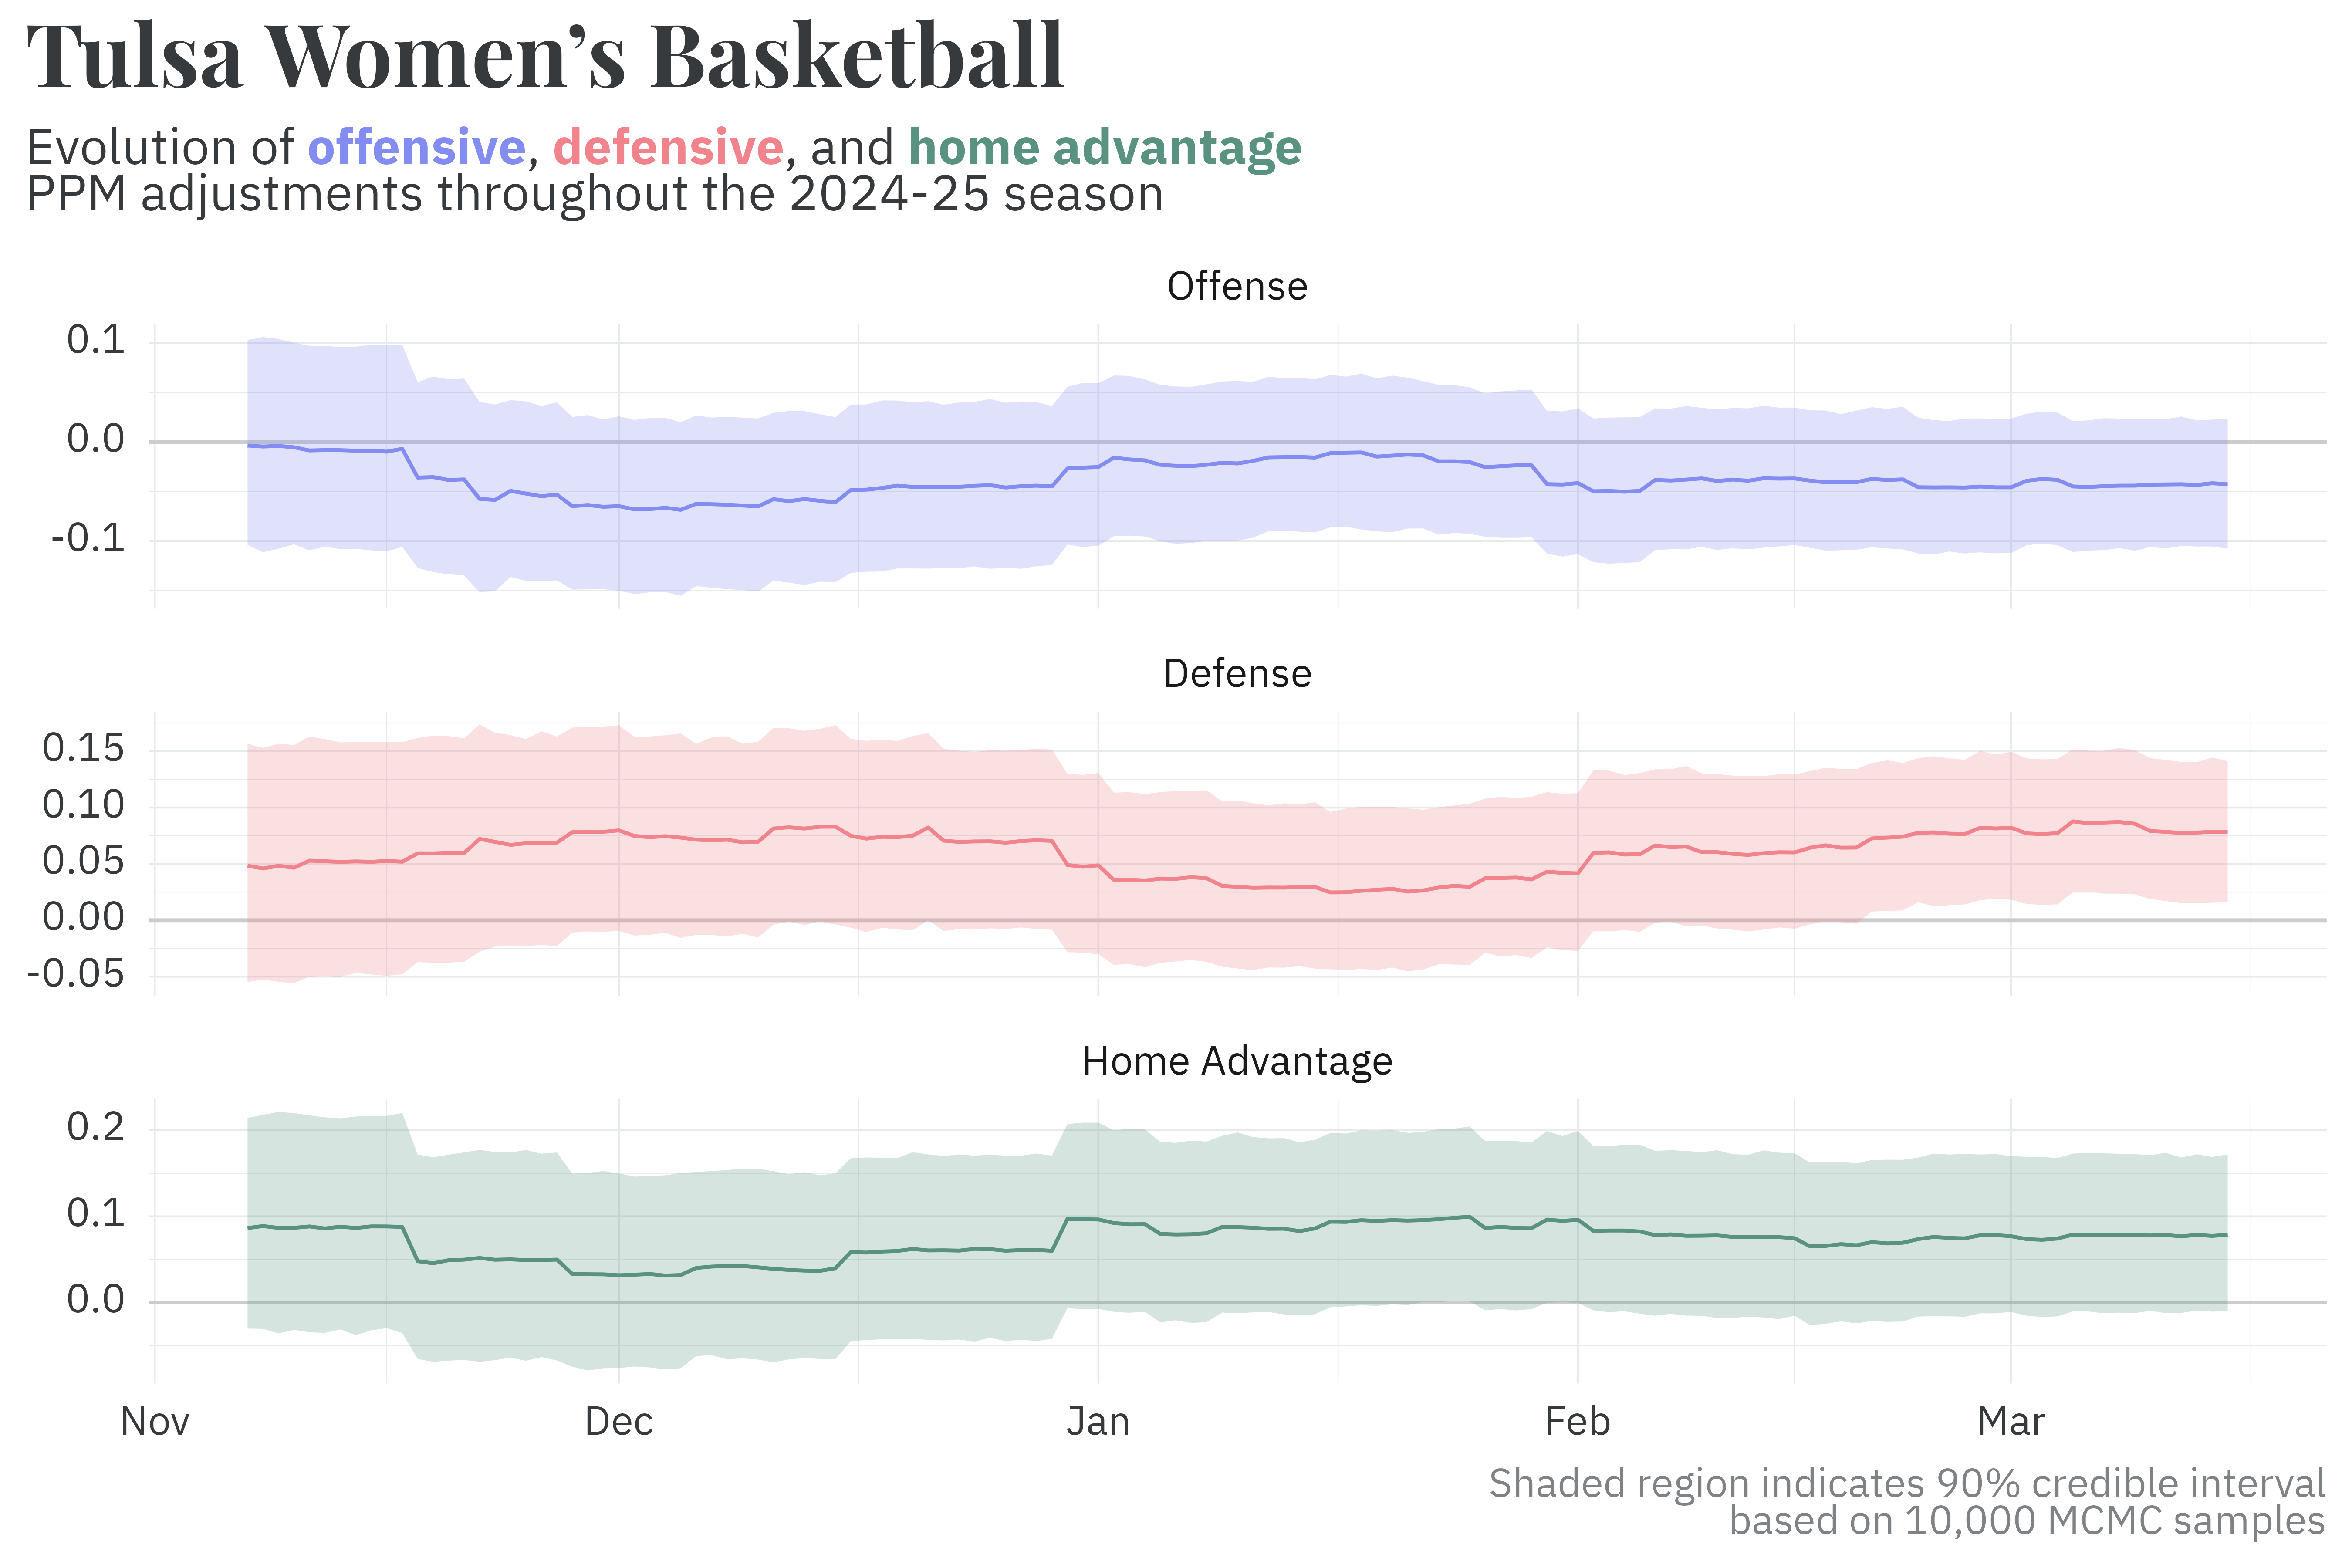
That’s pretty much it! All the other components below are slight variations on these two core pillars. I’ll walk through each component using my alma mater, the University of Tulsa, as an example.
History, not a mystery
For the 2001-02 through 2023-24 seasons, MADHATTRS estimates each team’s offensive, defensive, and home-court adjustments to PPM by iteratively fitting an entire season’s worth of data at a time. Since players graduate, leave for the NBA/WNBA, transfer, or simply get better/worse at the game, the historical model allows each team’s ratings to drift from season to season. In this pseudo-random walk, the prior for each season is the posterior from the previous season plus a bit of noise. This means that, especially at the beginning of each season, we tend to expect teams rankings to be similar to what they were in the previous season.
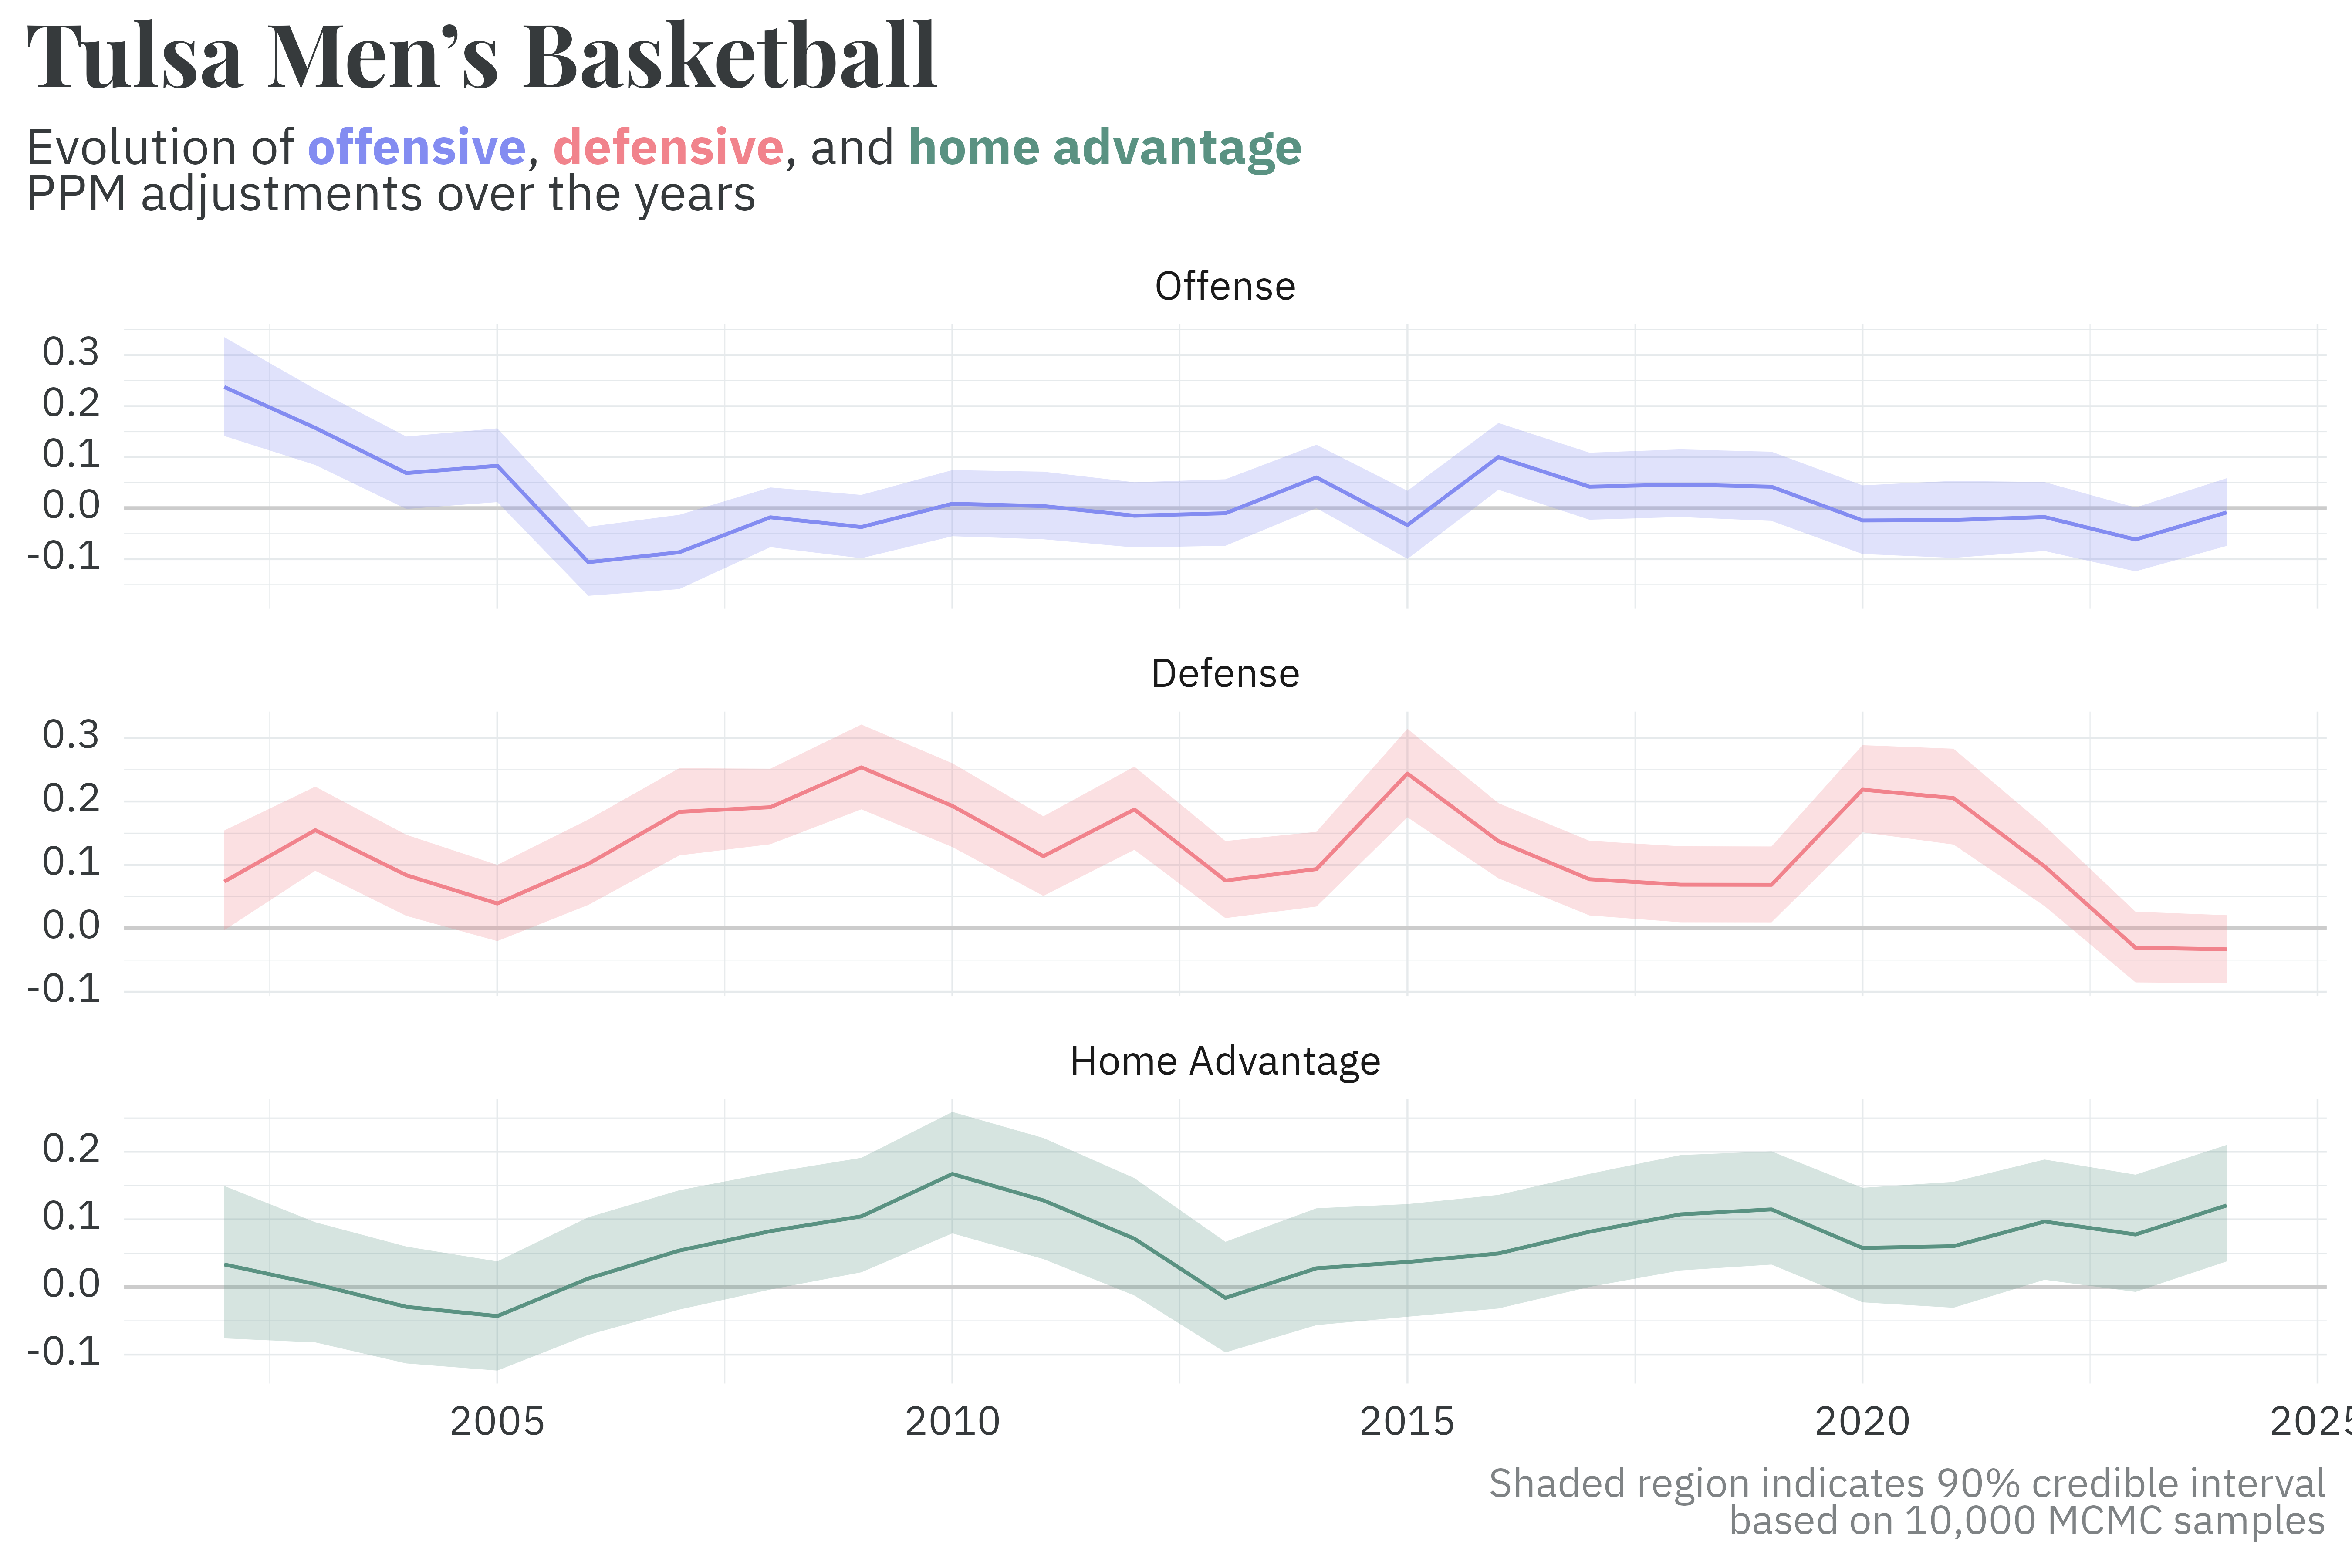
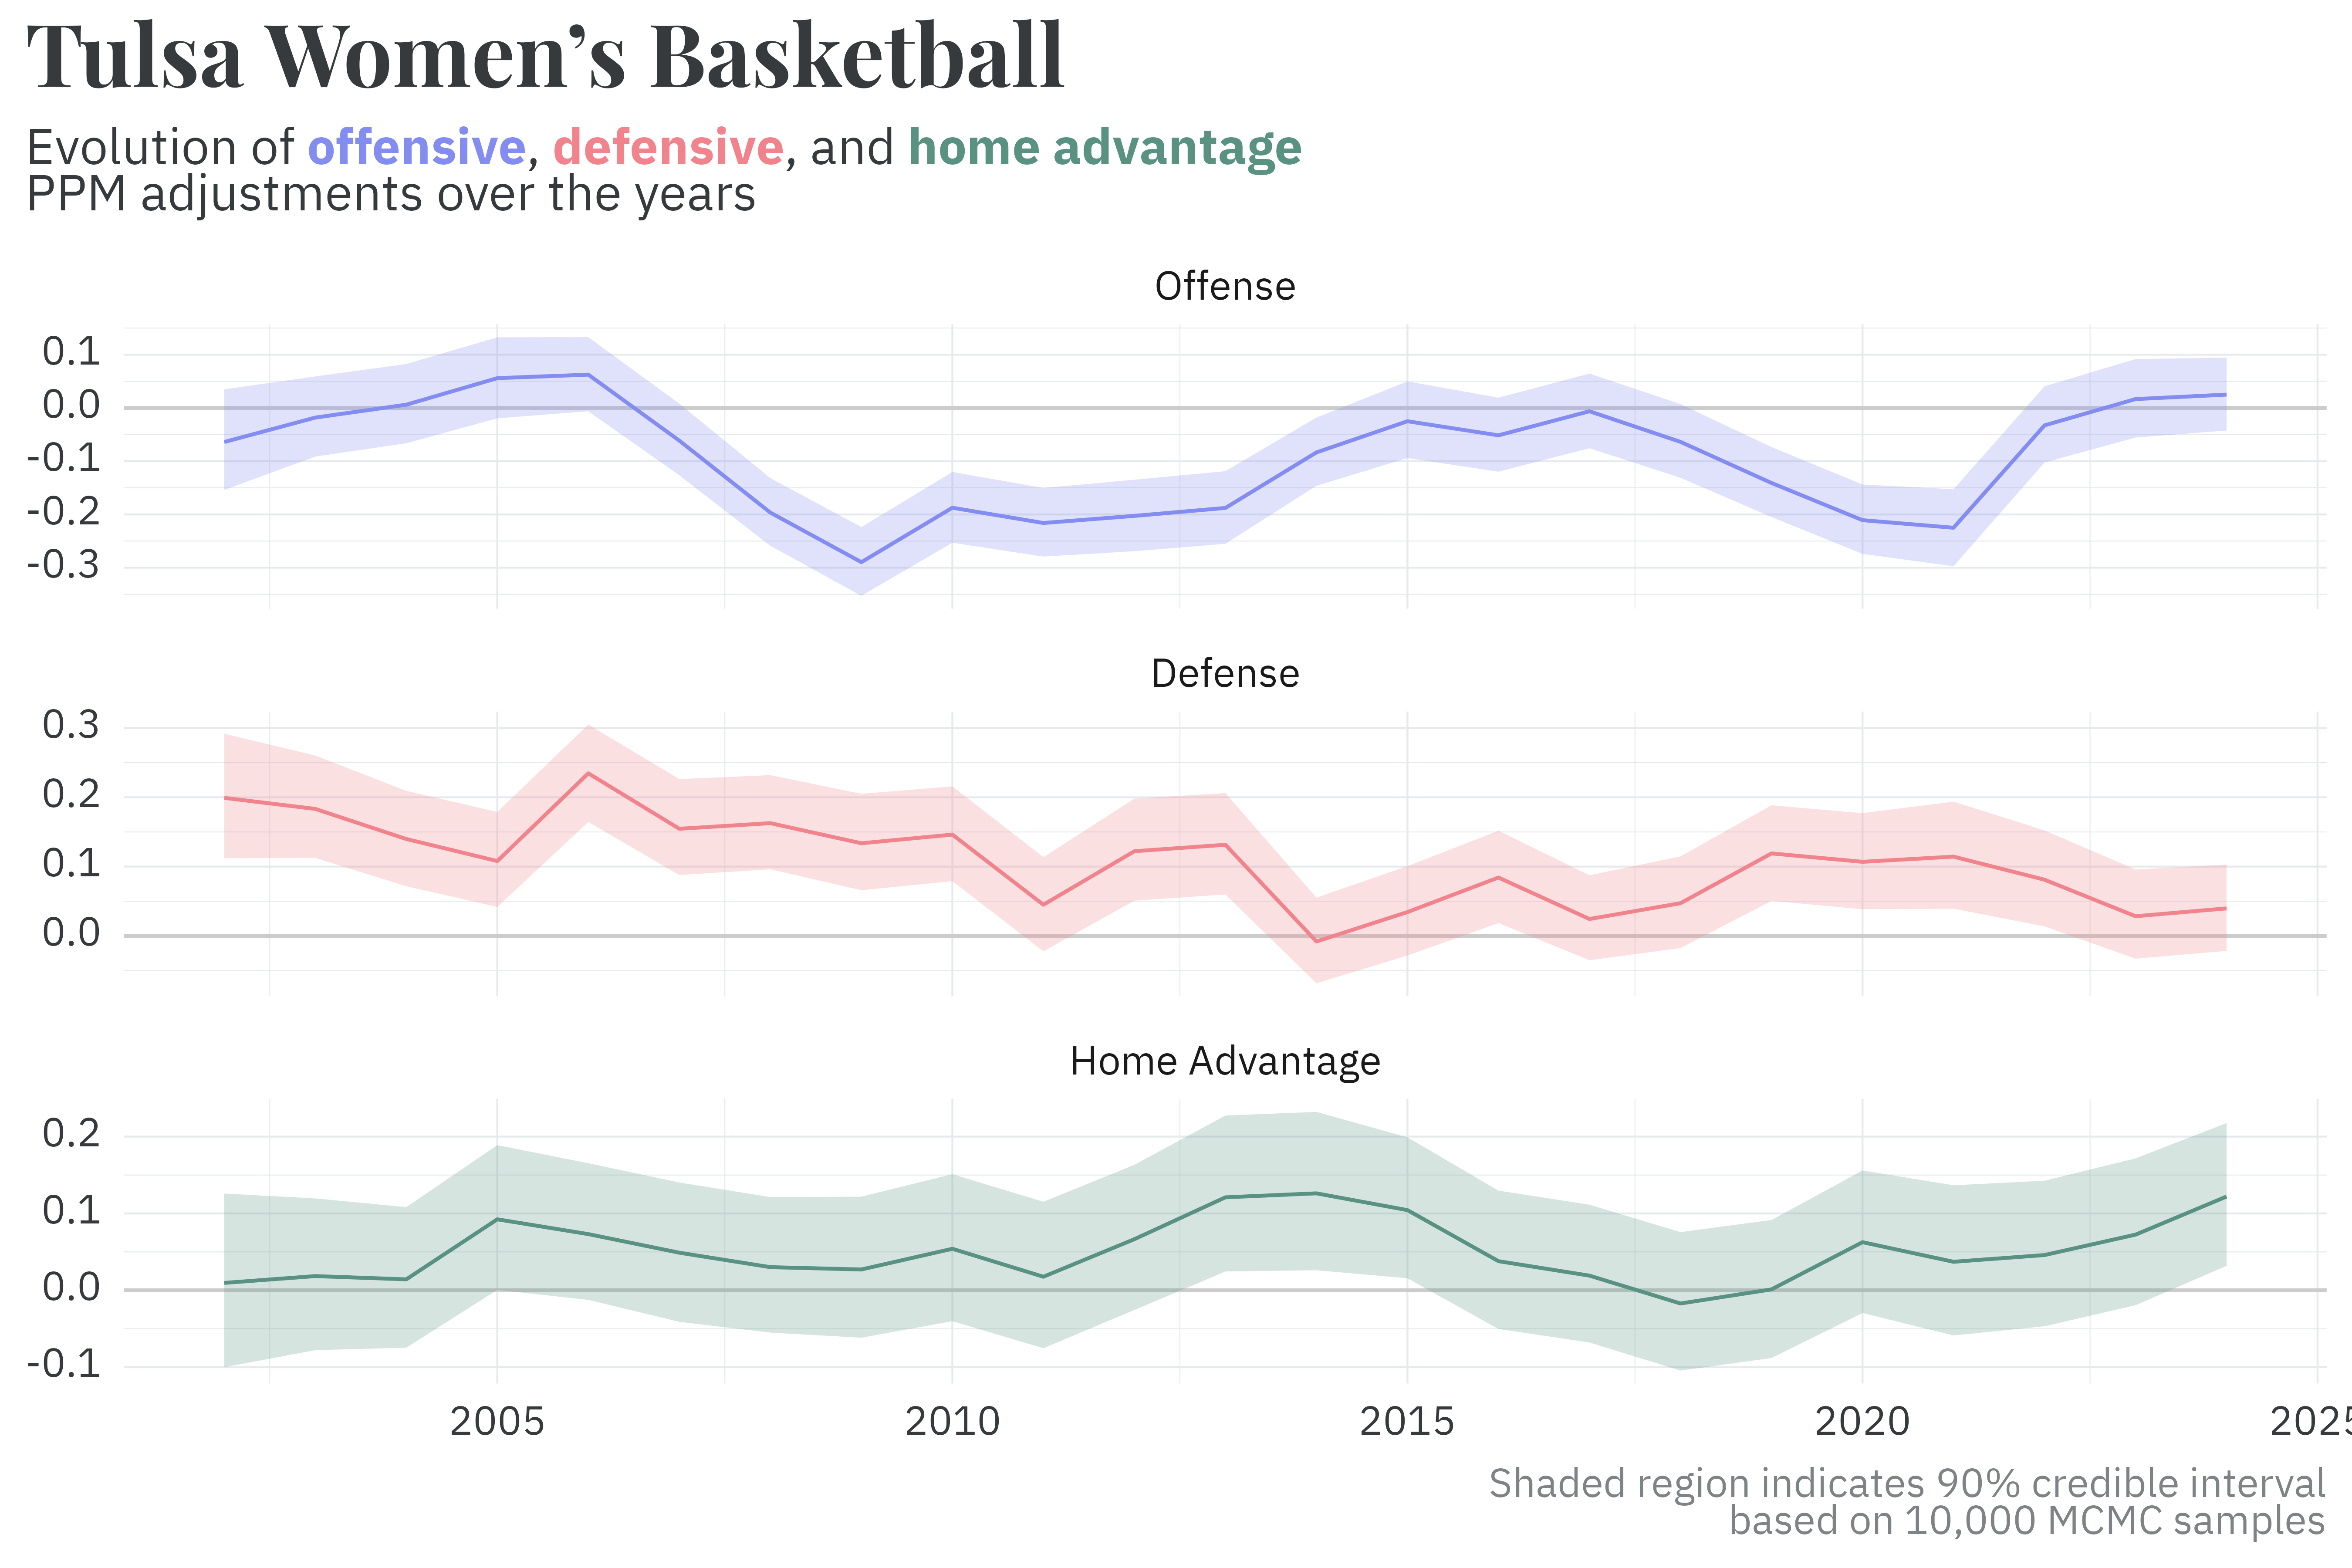
Tulsa’s basketball teams, for example, have defensive PPM adjustments that bounce somewhere between 0.0 and 0.2 PPM on average over the years, though the value drifts from season to season. This translates to an average reduction in their opponent’s score between 0 and 8 points for games ending in regulation.
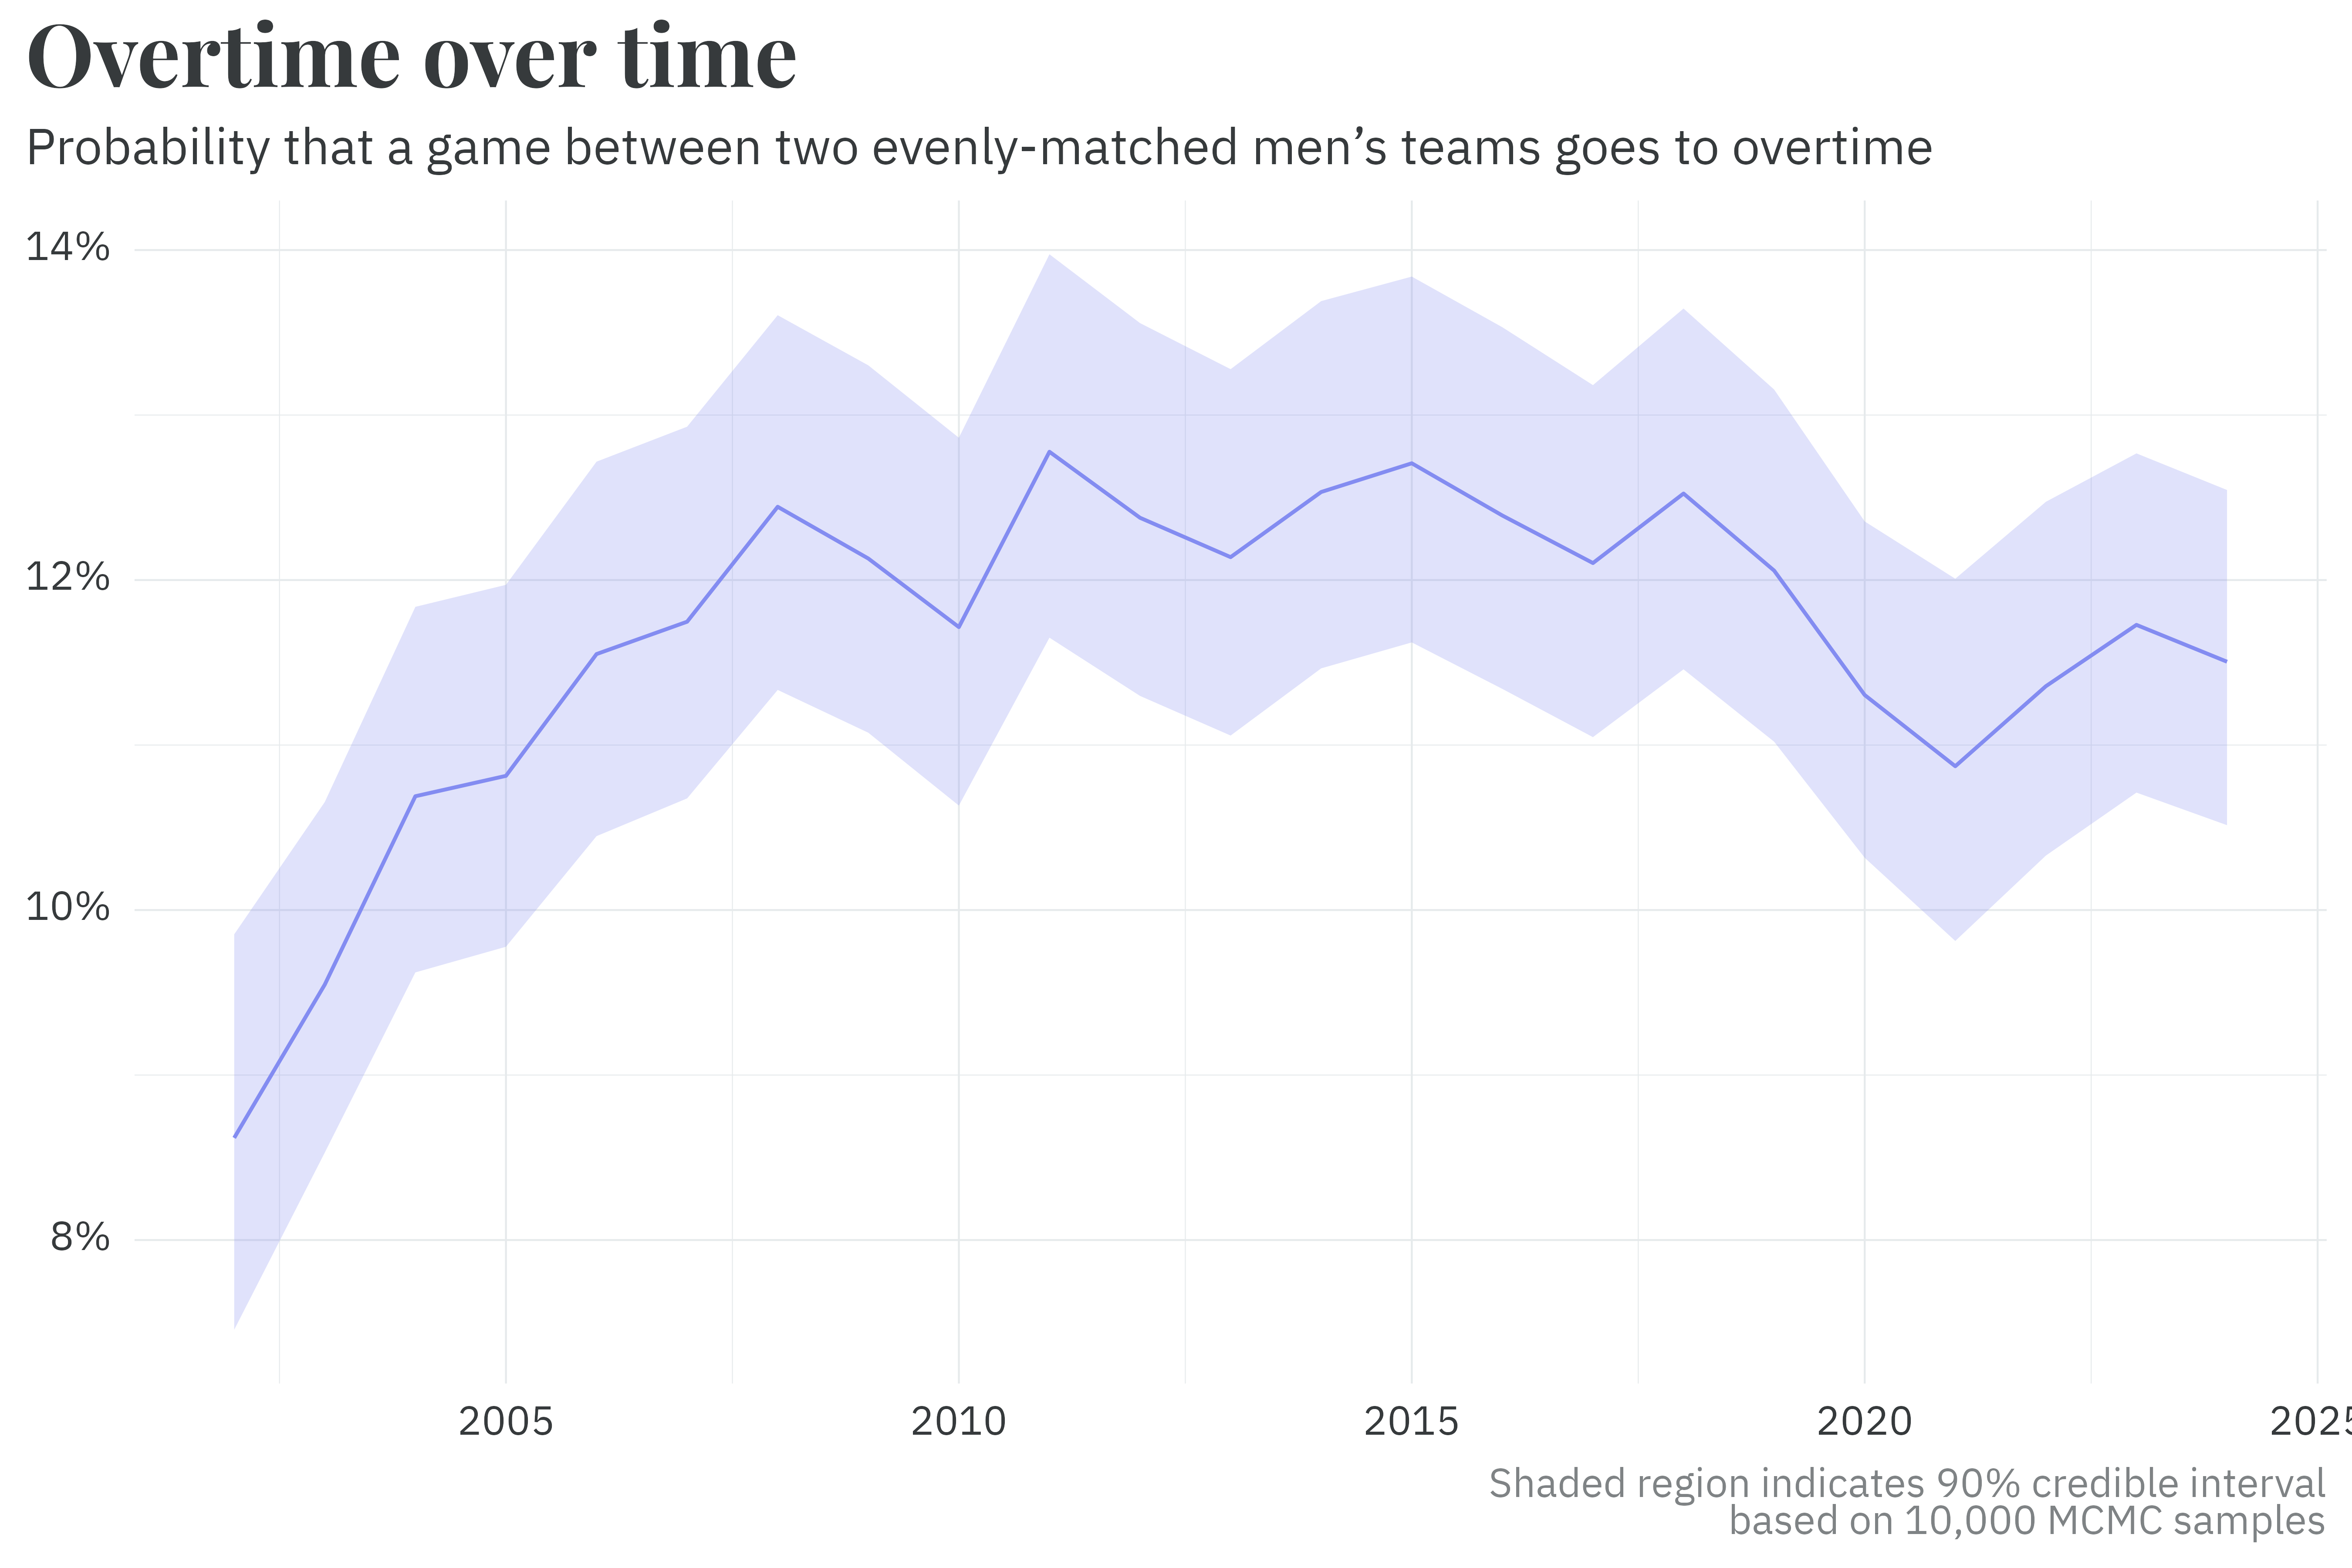
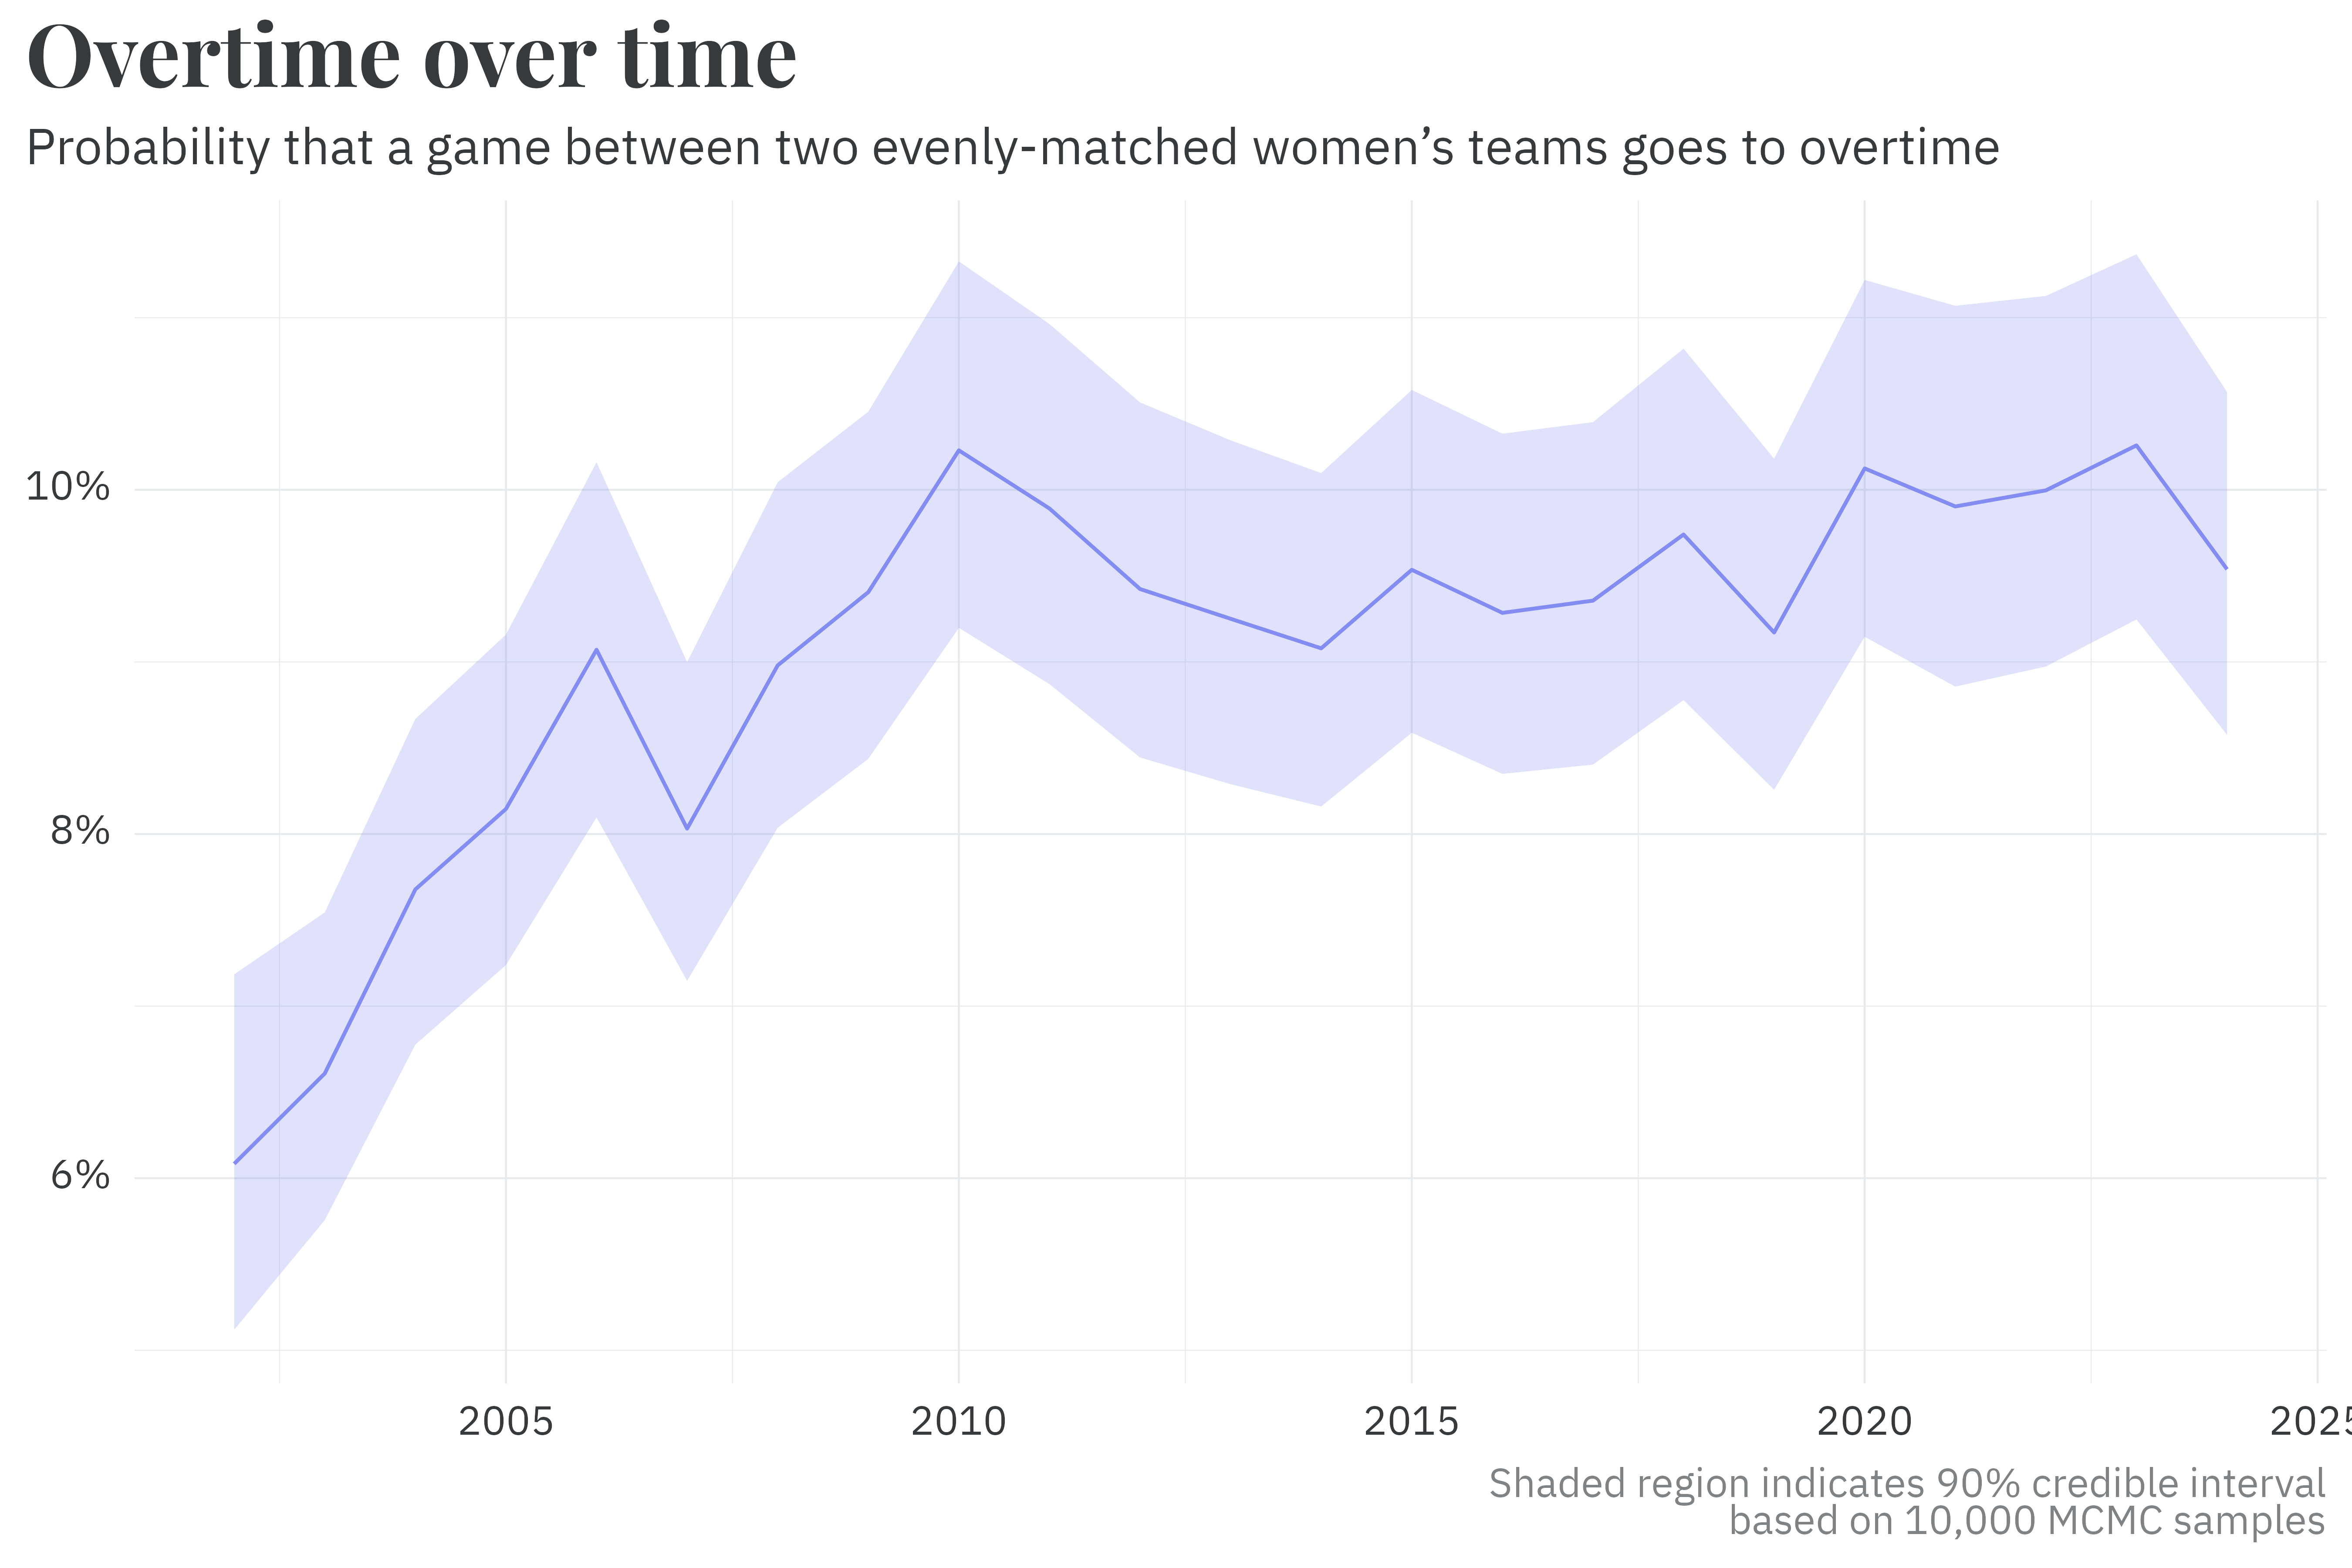
Much like team parameters, a similar pseudo-random walk method is used to estimate the probability of a game going to overtime. Per the model’s output, two evenly matched teams are likelier to go to overtime today than in the early 2000’s.
Season’s greetings
The 2024-25 season model is essentially the same as the historical model. The differences lie mostly in how the model is run and what output is stored.
Much like the historical model, the current season uses the previous season’s posterior as a prior to estimate season-level parameters. Unlike the historical model, the current season’s model is refit every day that at least one game is played. As the season progresses, the uncertainty around each parameter’s estimate decreases.
Similarly, the probability of going to overtime uses the previous season’s posterior as a prior and is updated every day.
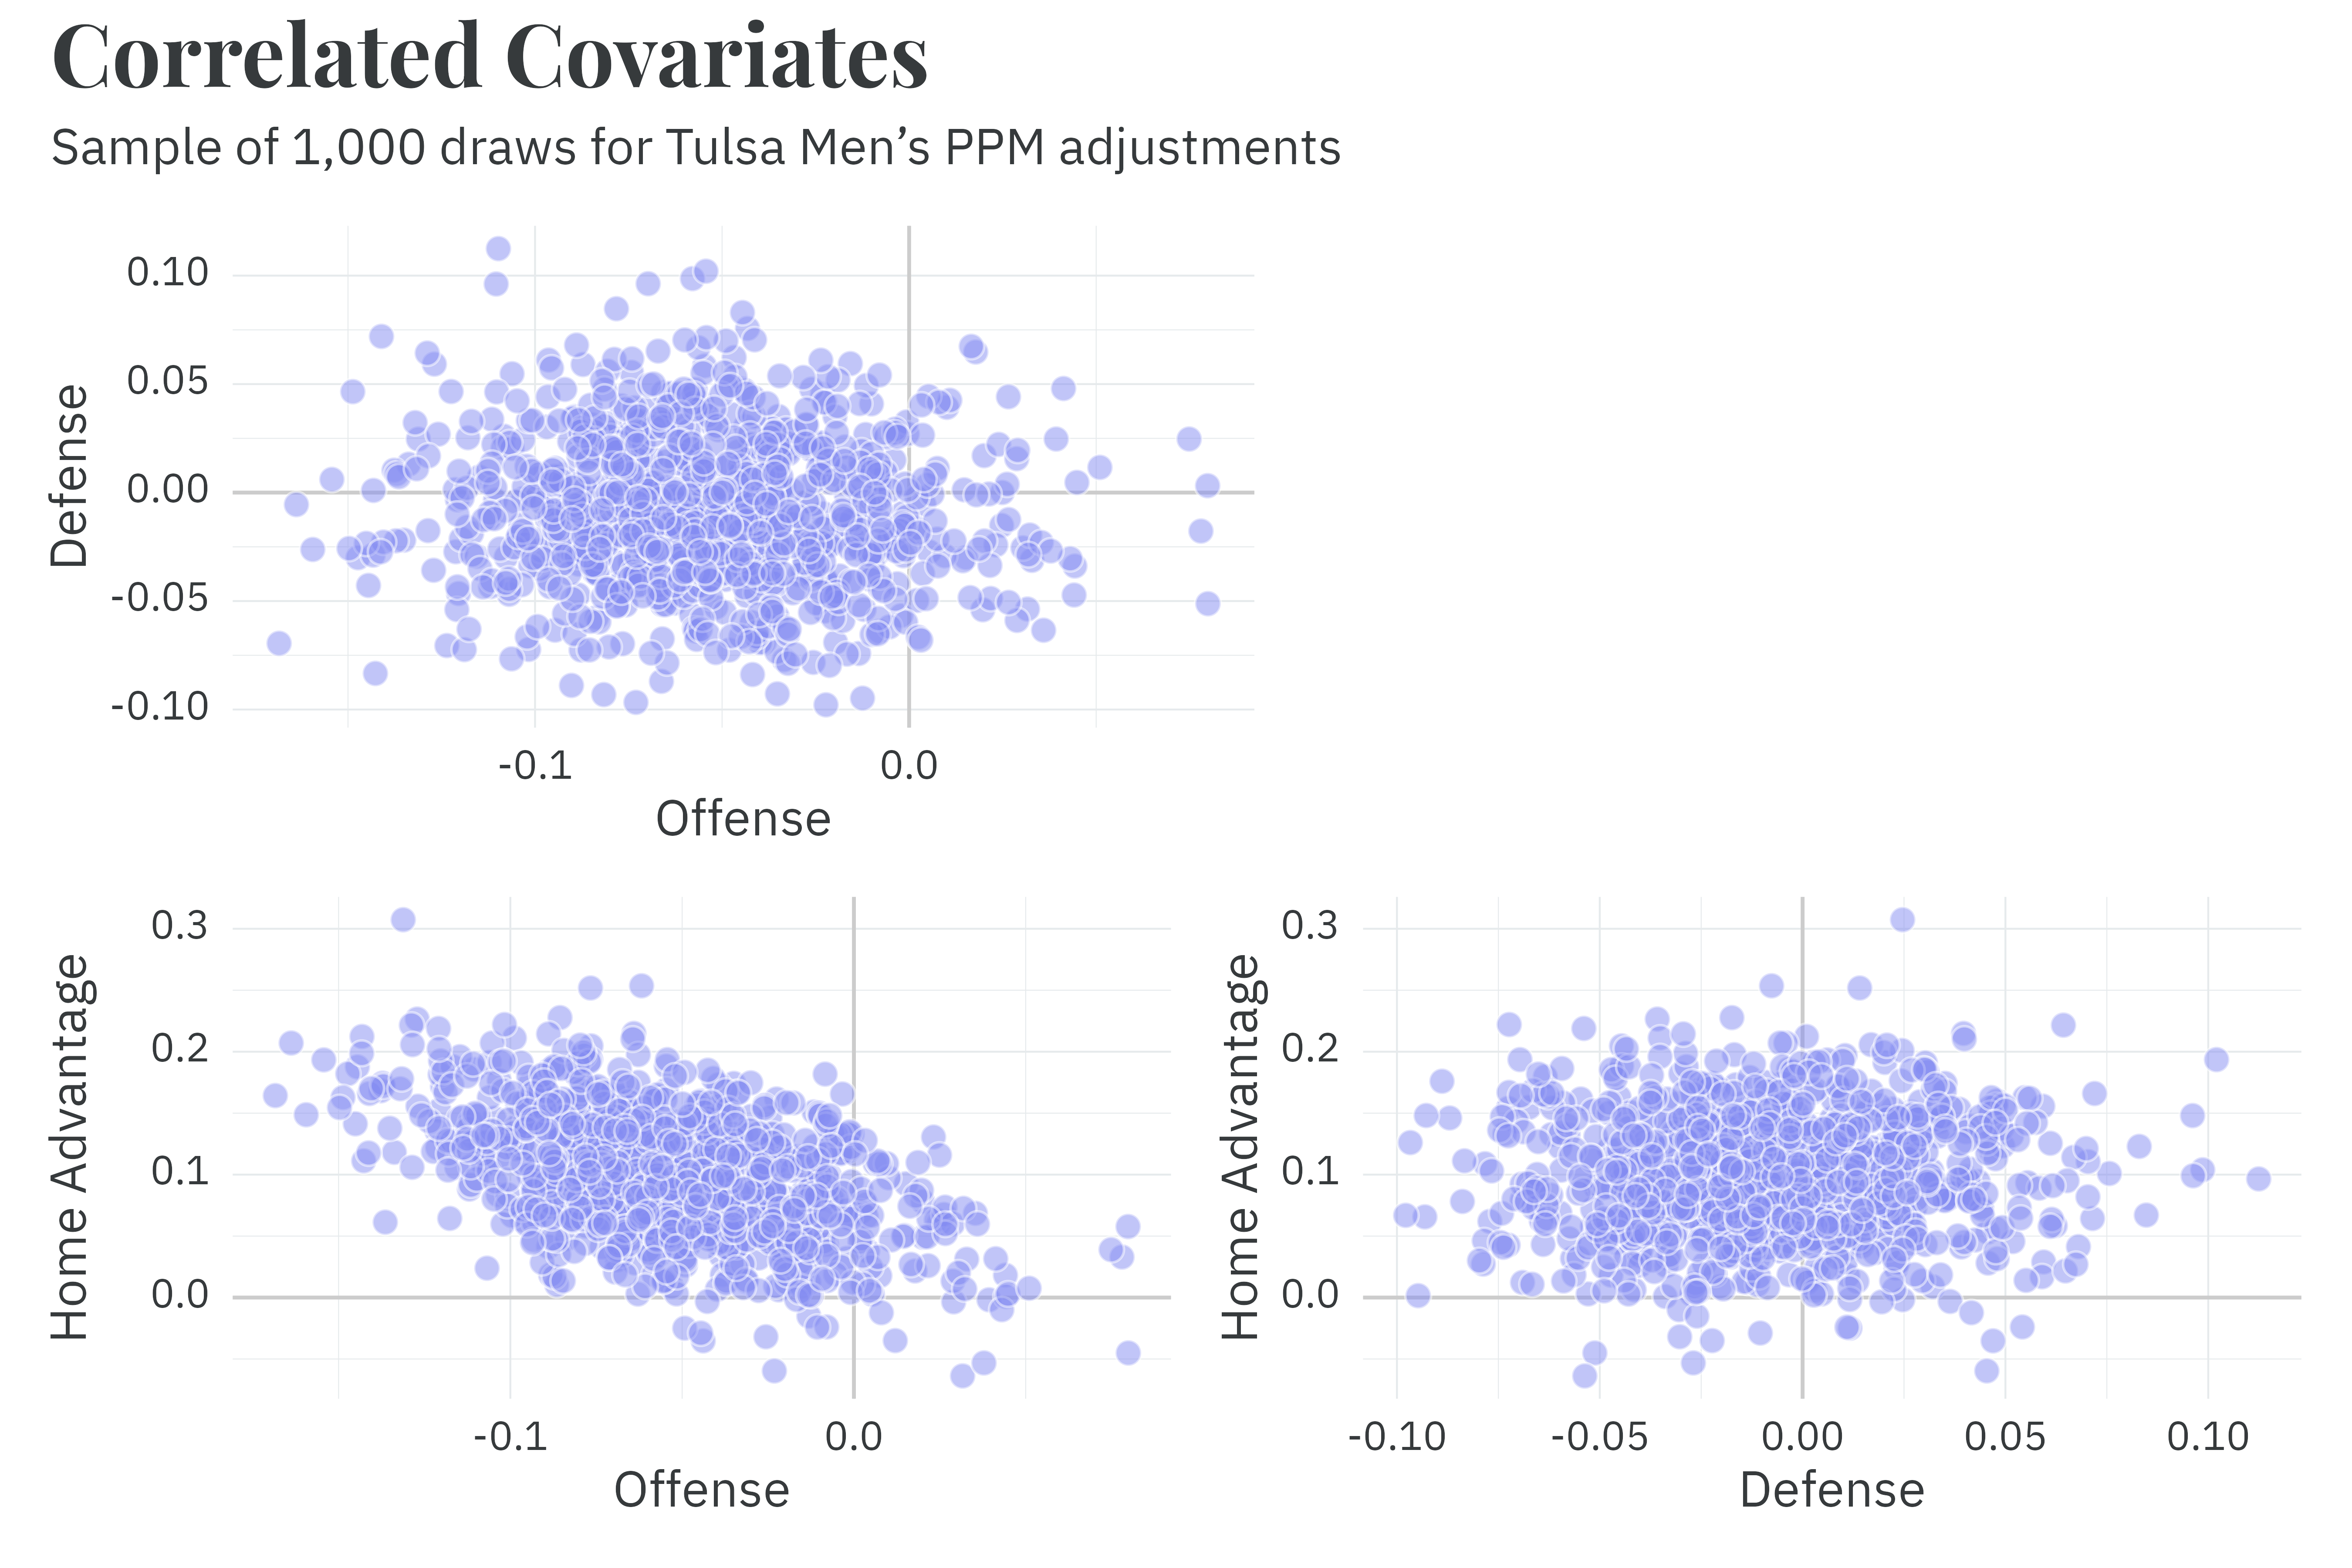
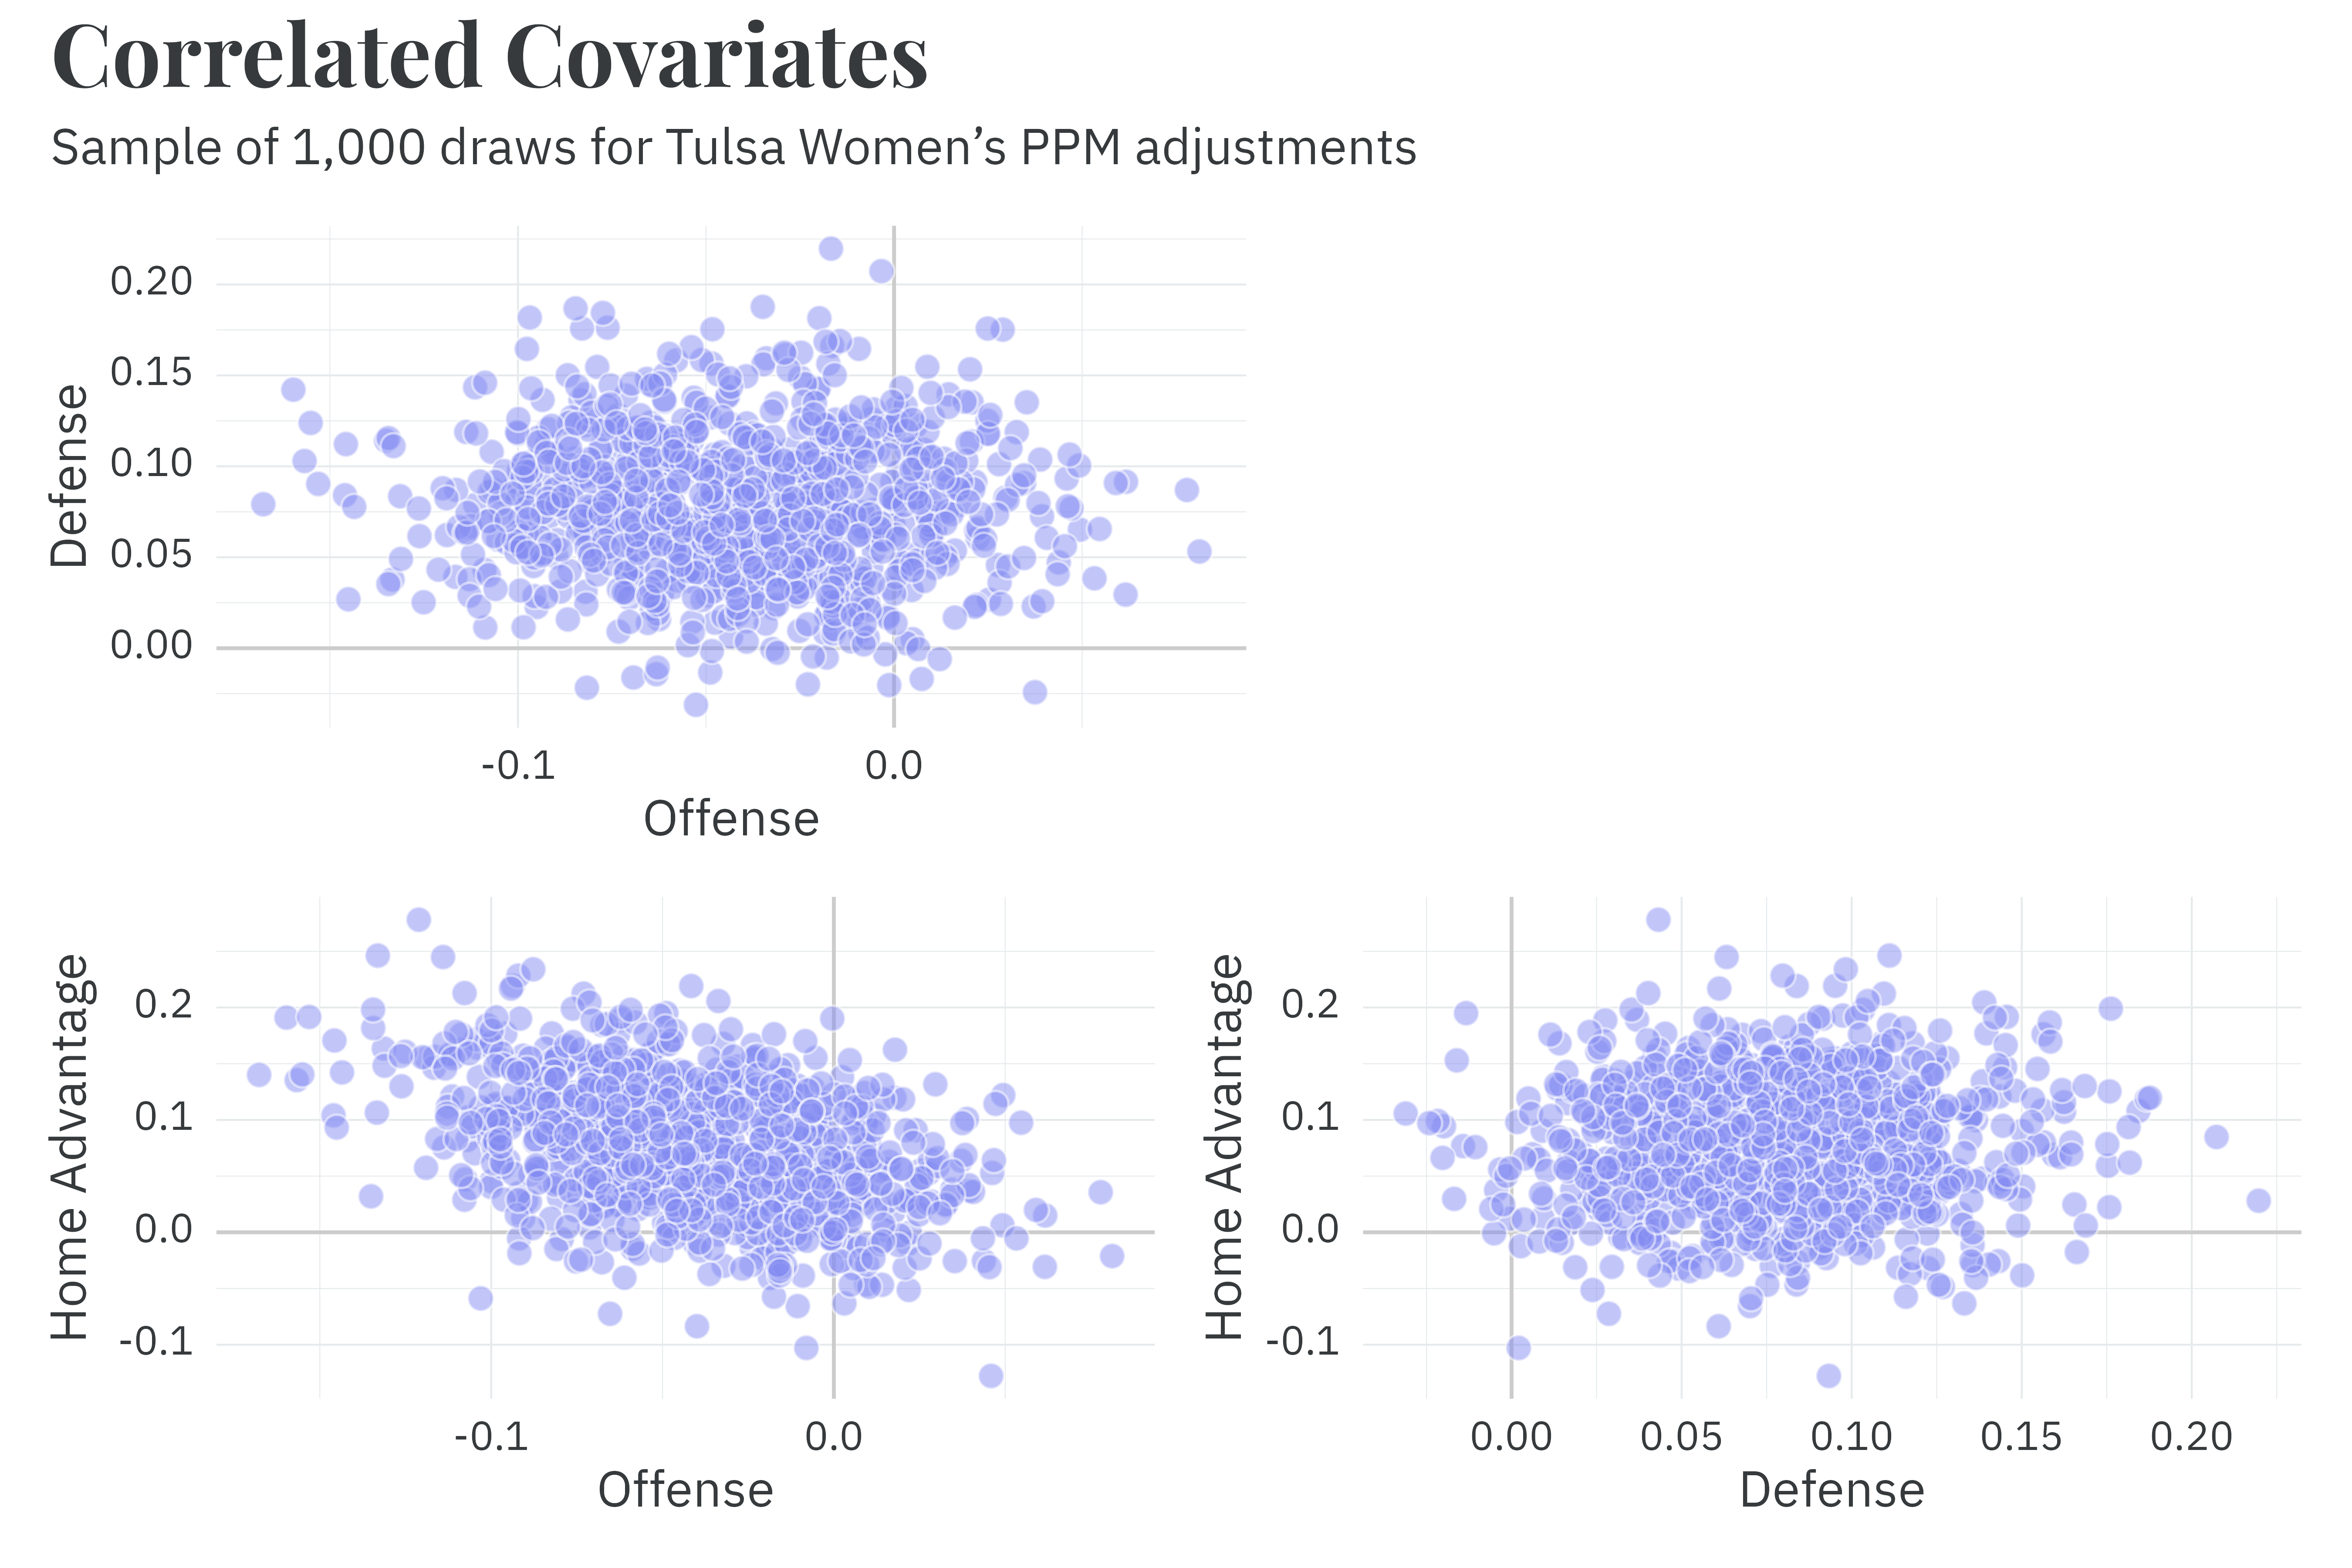
In addition to running daily, the season model is unique in that it records the correlation between parameters along with the parameters themselves. Preserving the correlation structure is important when it comes time to generate predictions. Team defensive PPM adjustments are effectively independent of offensive and home advantage adjustments, but there’s a noticeable negative correlation between the offensive and home advantage adjustments!
Running it back — prediction
To generate predictions, the process used to estimate ratings is simply run in reverse. For each game, the model first estimates whether or not the game will go to overtime and if so, the number of overtime periods played. If the game goes to overtime, the model then guesses what the tied score was leading into the final overtime period.6 Finally, it uses each team’s PPM estimates to simulate the number of points scored in the final period7 and adds that to the previously tied score to get to the final score.8 This process is repeated thousands of times to get a distribution of possible final scores. Each team’s probability of winning is simply the proportion of simulations in which they emerge victorious.
6 In simulations that end in regulation, this is set to 0-0.
7 In the majority of simulations, this “final period” is just the end of regulation.
8 There are some tricks under the hood to ensure that the final score isn’t a tie.
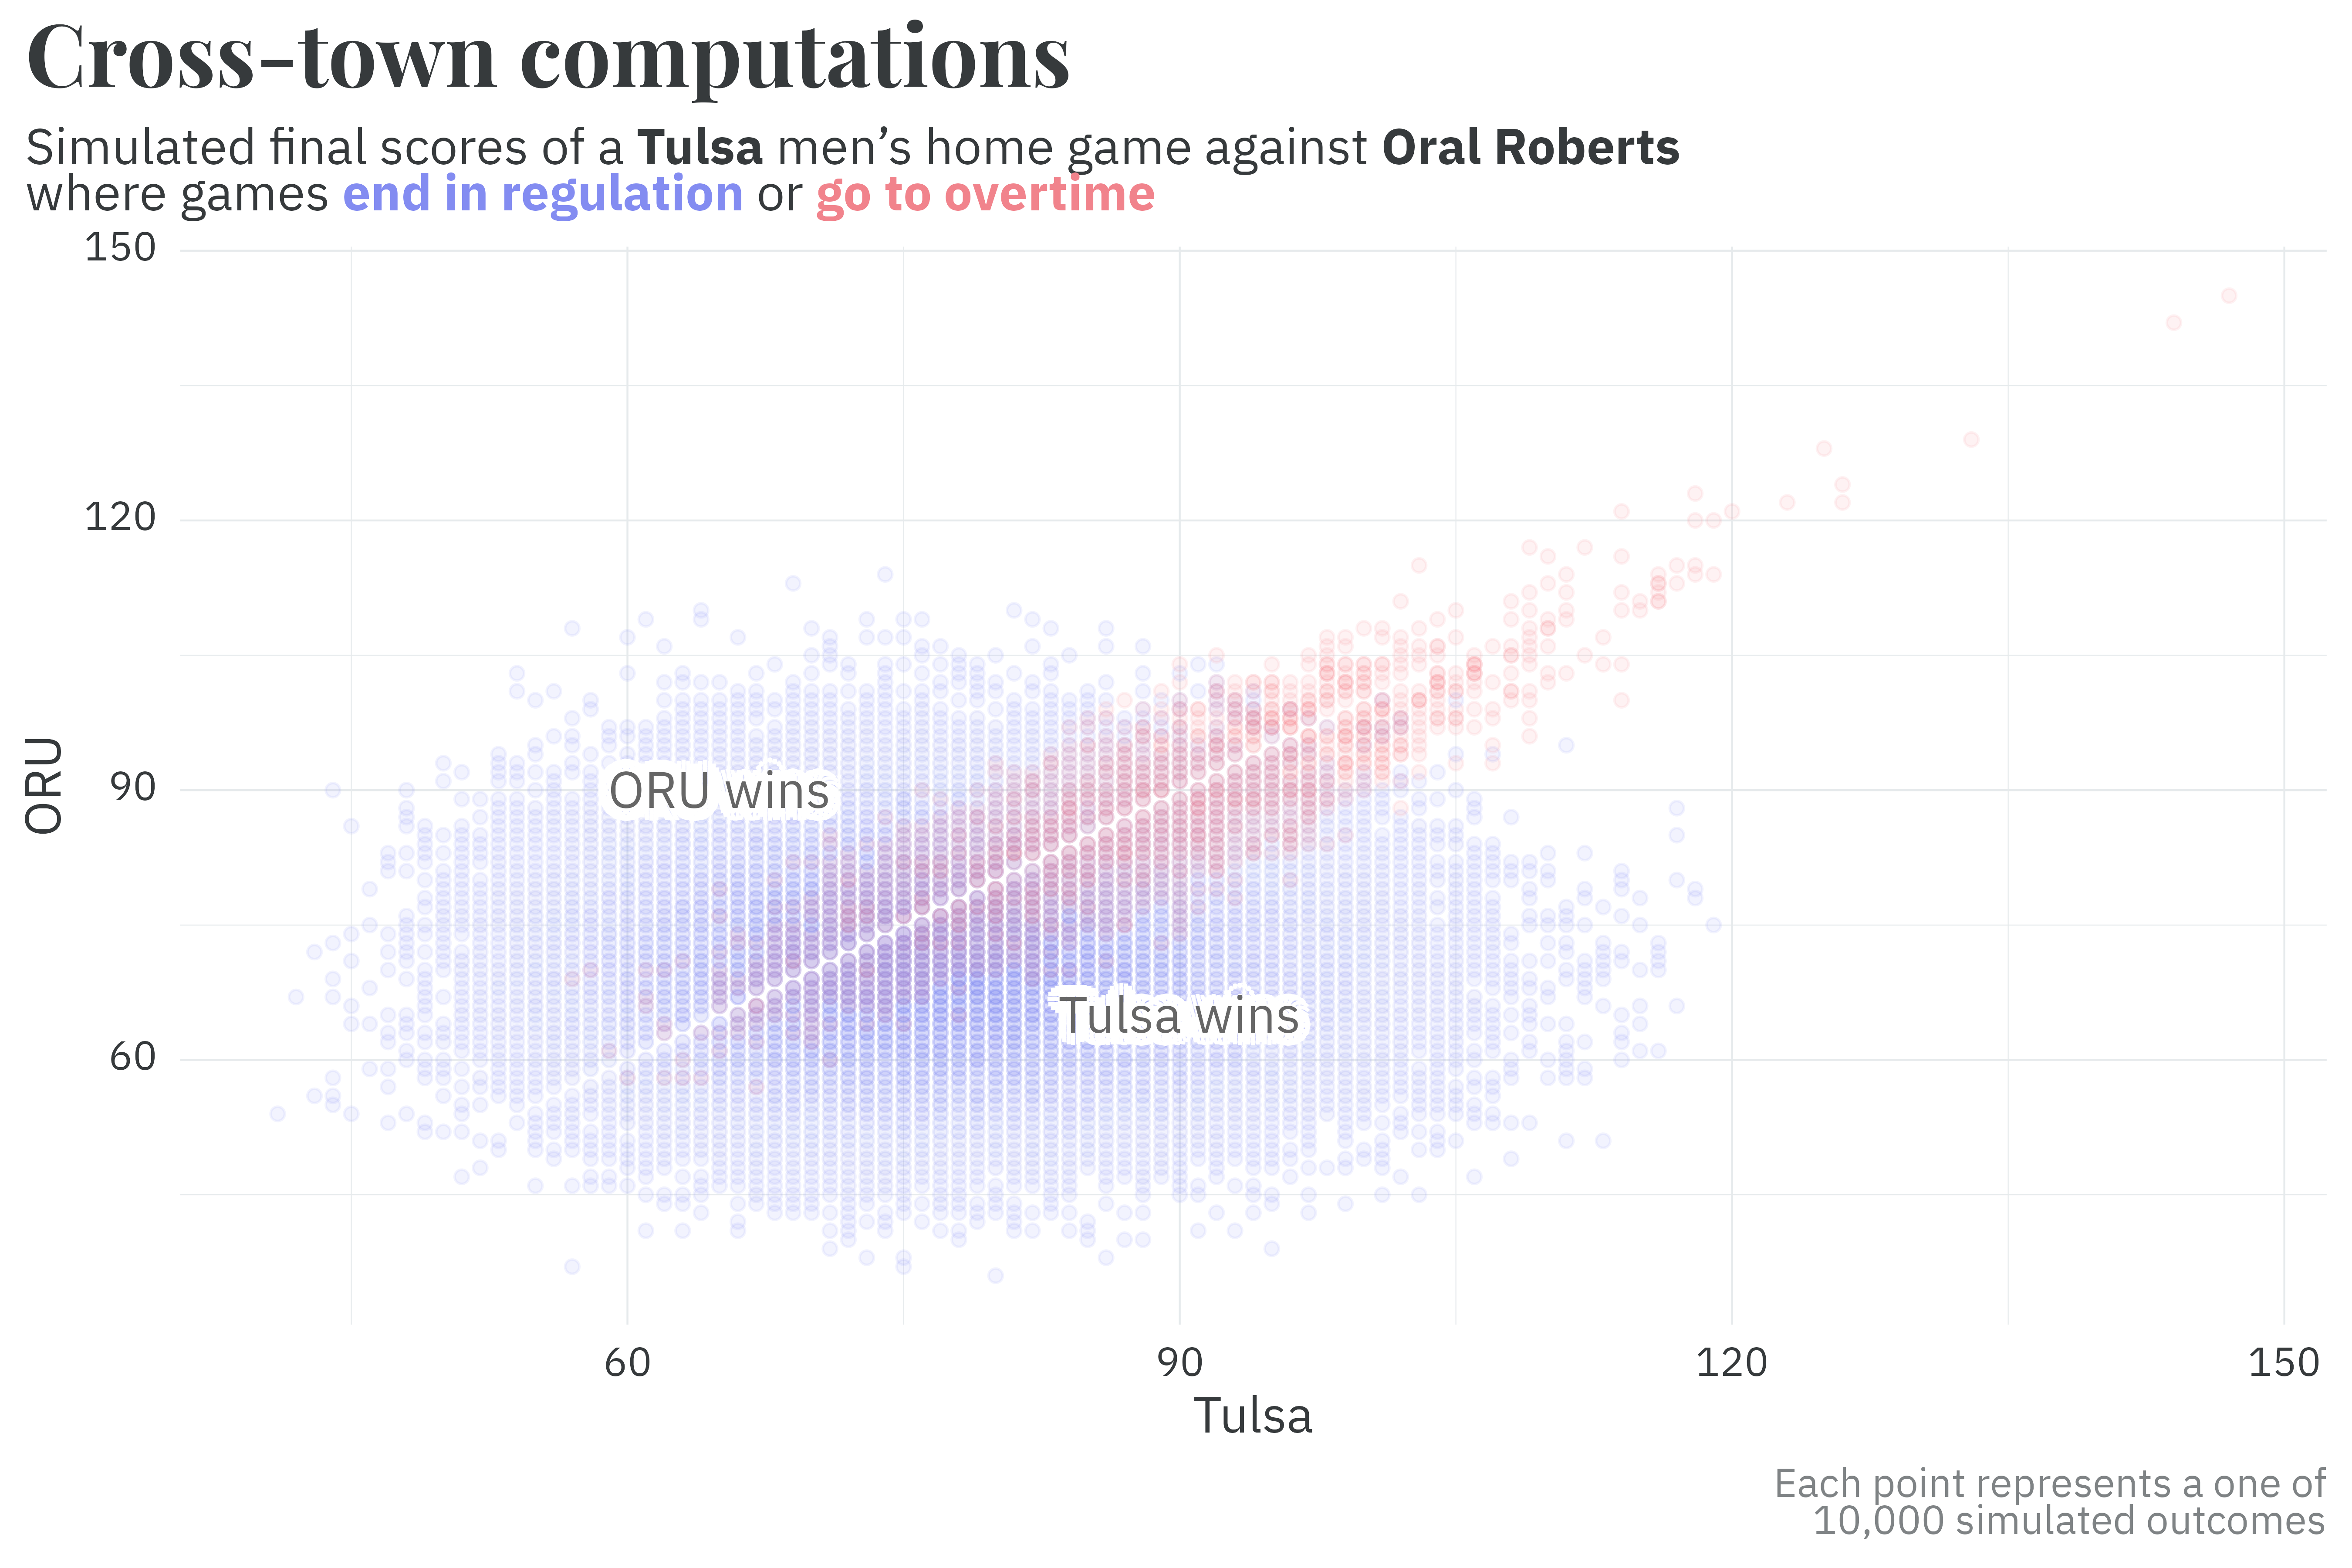
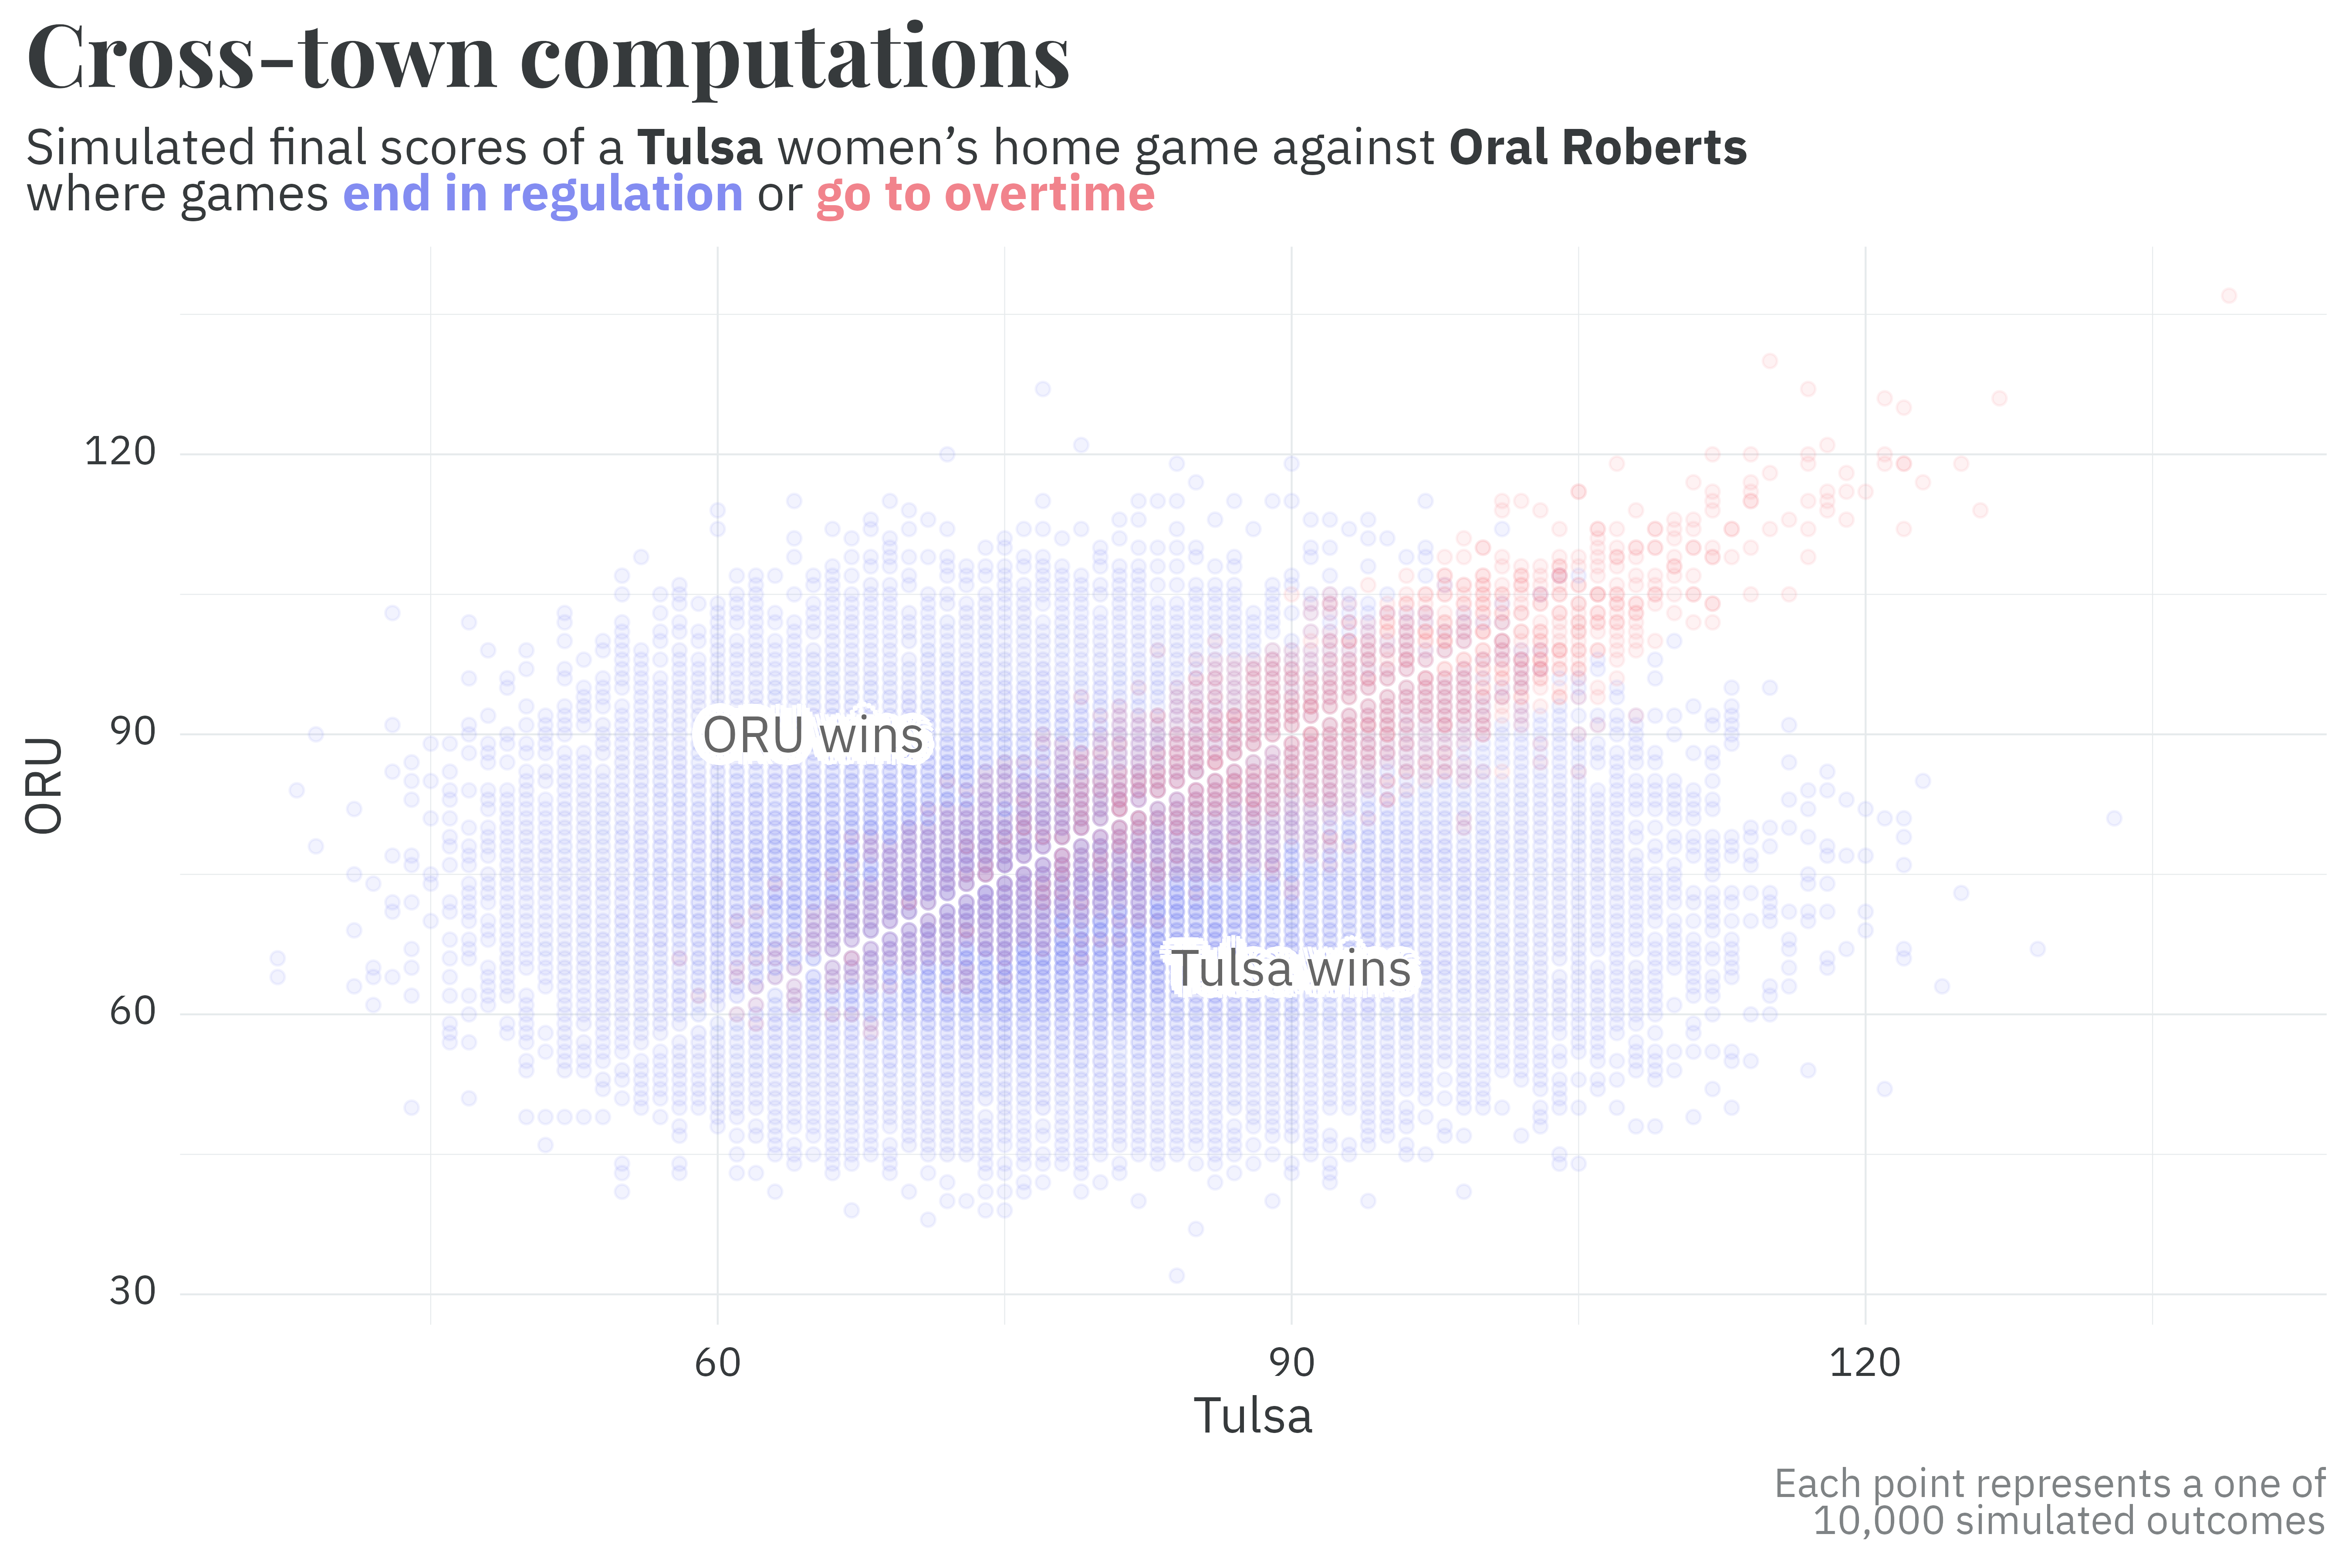
As an example, let’s simulate a Tulsa home game against their cross-town rival, ORU — each point below is a simulated outcome. The majority of simulations end in regulation and include everything from blowouts for either team close finishes. Simulations that go to overtime (potentially many overtimes!) unsurprisinglying tend to result in more points for both teams and a closer final score. Based on this set of simulations, Tulsa’s men’s team has a 67% chance of winning and the women’s team has a 58% chance of winning.
9 billion-billion brackets
In the regular season, MADHATTRS generates game outcomes by simulating an individual game thousands of times. In the playoffs, it simulates the entire tournament thousands of times. Each team’s probability of advancing (or winning the tournament) is the proportion of simulations in which they reach that milestone.
Since the tournament is single-elimination, the simulations includes weird edge cases with huge upsets alongside very normal tournaments in which all the 1 and 2 seeds beat the 15 and 16 seeds. The result is a mixture of potential tournament outcomes. Effectively, this means that the the probability of each team advancing to the next stage in the bracket is based on the team’s skill pitted against their potential strength of schedule.
There are 2 × 1063 (or 9 billion-billion) possible March Madness brackets. Although I didn’t run quite that many simulations,9 my hope is that in the thousands of simulations that are run, I capture some of the madness that will emerge from the tournament.
9 Based on some back-of-the-napkin math, it’d take ~14 million years for that to run. Unfortunately, the first game is only a few days away!
Citation
BibTeX citation:
@online{rieke2025,
  author = {Rieke, Mark},
  title = {MADHATTRS},
  date = {2025-03-16},
  url = {https://www.thedatadiary.net/posts/2025-03-16-march-madness/},
  langid = {en}
}
For attribution, please cite this work as:
Rieke, Mark. 2025. “MADHATTRS.” March 16. https://www.thedatadiary.net/posts/2025-03-16-march-madness/.